Introduction: A Test, a Picture and a Stance
In 2017 the Gapminder Foundation asked polling companies in fourteen countries to put thirteen fact questions about the world to online panels weighted for each country's demographic composition, each question with three answer options (16, Gapminder Foundation, 2017). Hans Rosling had been putting versions of those questions to audiences for years, and the results became the opening of Factfulness (8, Rosling et al., 2018). I do not repeat his questions or his results here. What I have borrowed is the method: ask first, show the measured answer second, and only then talk about why the two differ.
This book is about a narrower world than Rosling's. It is the world that appears inside a large European enterprise or public authority when its architecture becomes code and artificial intelligence (AI) goes to work in it, as an assistant to a person, as a feature a supplier switched on, or as an agent acting on the organisation's systems with an identity of its own. I call that world the landscape. Executives decide about it, architects build it, elected officials regulate it, journalists report on it and citizens live with its results. Most of us carry a picture of it that is a few years out of date, and the picture matters more than the facts, because it is the picture we reason from.
The test comes first. Take it with a pencil, alone or with your team, and write down your answers before you turn to the measured ones. Nobody will see your score. There are fourteen questions, three options each, and every answer traces to a public dataset listed in Appendix C. The rest of the chapter gives the answers, introduces the picture the book draws instead, grades the data it rests on, states my stance, introduces two fictional organisations and says how to read the book.
The test
Answer every question before you read on, choosing the option closest to what you believe the measured answer to be. Where a question names a year, it is the latest year for which the data had been published when this book went to press. If you take the test with a team, copy the questions and options onto one page without the answers, collect everyone's letters first, and only then turn the page; comparing answers before anyone has seen the measured ones is the useful part.
Question 1. In 2025, what share of enterprises in the EU with at least ten employees used at least one artificial-intelligence technology?
- A. About 20 per cent
- B. About 45 per cent
- C. About 70 per cent
Question 2. Among large enterprises in the EU (250 employees or more), what share used at least one AI technology in 2025?
- A. About 25 per cent
- B. About 40 per cent
- C. About 55 per cent
Question 3. Between 2021 and 2023, the share of EU enterprises using AI changed by how much?
- A. It roughly doubled
- B. It rose by less than one percentage point
- C. It fell
Question 4. Of the EU enterprises that used AI in 2025, what share used three or more different AI technologies?
- A. About one in ten
- B. About four in ten
- C. About eight in ten
Question 5. In 2025, what share of EU enterprises bought at least one paid cloud computing service?
- A. About 25 per cent
- B. About 50 per cent
- C. About 80 per cent
Question 6. In 2025, what share of people aged 16 to 74 in the EU had used a generative AI tool for work in the previous three months?
- A. About 15 per cent
- B. About 35 per cent
- C. About 60 per cent
Question 7. In the 2024 survey, what share of EU enterprises reported an ICT security incident that made services unavailable, destroyed data or disclosed confidential data?
- A. About 5 per cent
- B. About 12 per cent
- C. About 20 per cent
Question 8. ICT specialists made up what share of total employment in the EU in 2025?
ICT specialists are people whose occupation is to develop, run or support information and communication technology systems, as Eurostat defines it by occupation codes.
- A. About 5 per cent
- B. About 12 per cent
- C. About 20 per cent
Question 9. The Commission's Digital Decade dashboard sets 75 per cent as the 2030 target for the share of EU enterprises using AI. Following the trend as the 2023 edition of its baseline drew it, where would the share have reached in 2030?
The Digital Decade is the EU's programme of digital targets for 2030; a baseline is the line the Commission draws from past performance to 2030.
- A. About 20 per cent
- B. About 45 per cent
- C. About 75 per cent
Question 10. What was the most common purpose for which EU enterprises used AI in 2025?
- A. ICT security
- B. Production processes
- C. Marketing or sales
Question 11. In the AI Incident Database, which kind of harm is the most frequent among the incidents that have been classified?
- A. An autonomous system escaping control
- B. People using AI to defraud, deceive or manipulate other people
- C. Physical injury from robots and self-driving vehicles
Question 12. In the AI Act as amended in 2026, when do the obligations for high-risk AI systems listed in Annex III apply?
Annex III is the AI Act's list of high-risk uses, such as AI in recruitment and work management, education, access to essential services and law enforcement.
- A. They already apply
- B. From 2 December 2027
- C. They were repealed
Question 13. Among developers who answered the Stack Overflow survey in 2025, what share said they highly trust the accuracy of AI tools' output?
- A. Under 5 per cent
- B. About 30 per cent
- C. About 60 per cent
Question 14. In 2024 and 2025, what share of workers in the EU said that a device or software automatically allocated their work tasks?
- A. About 5 per cent
- B. About 10 per cent
- C. About 20 per cent
Write your fourteen letters down now. The answers follow.
The answers
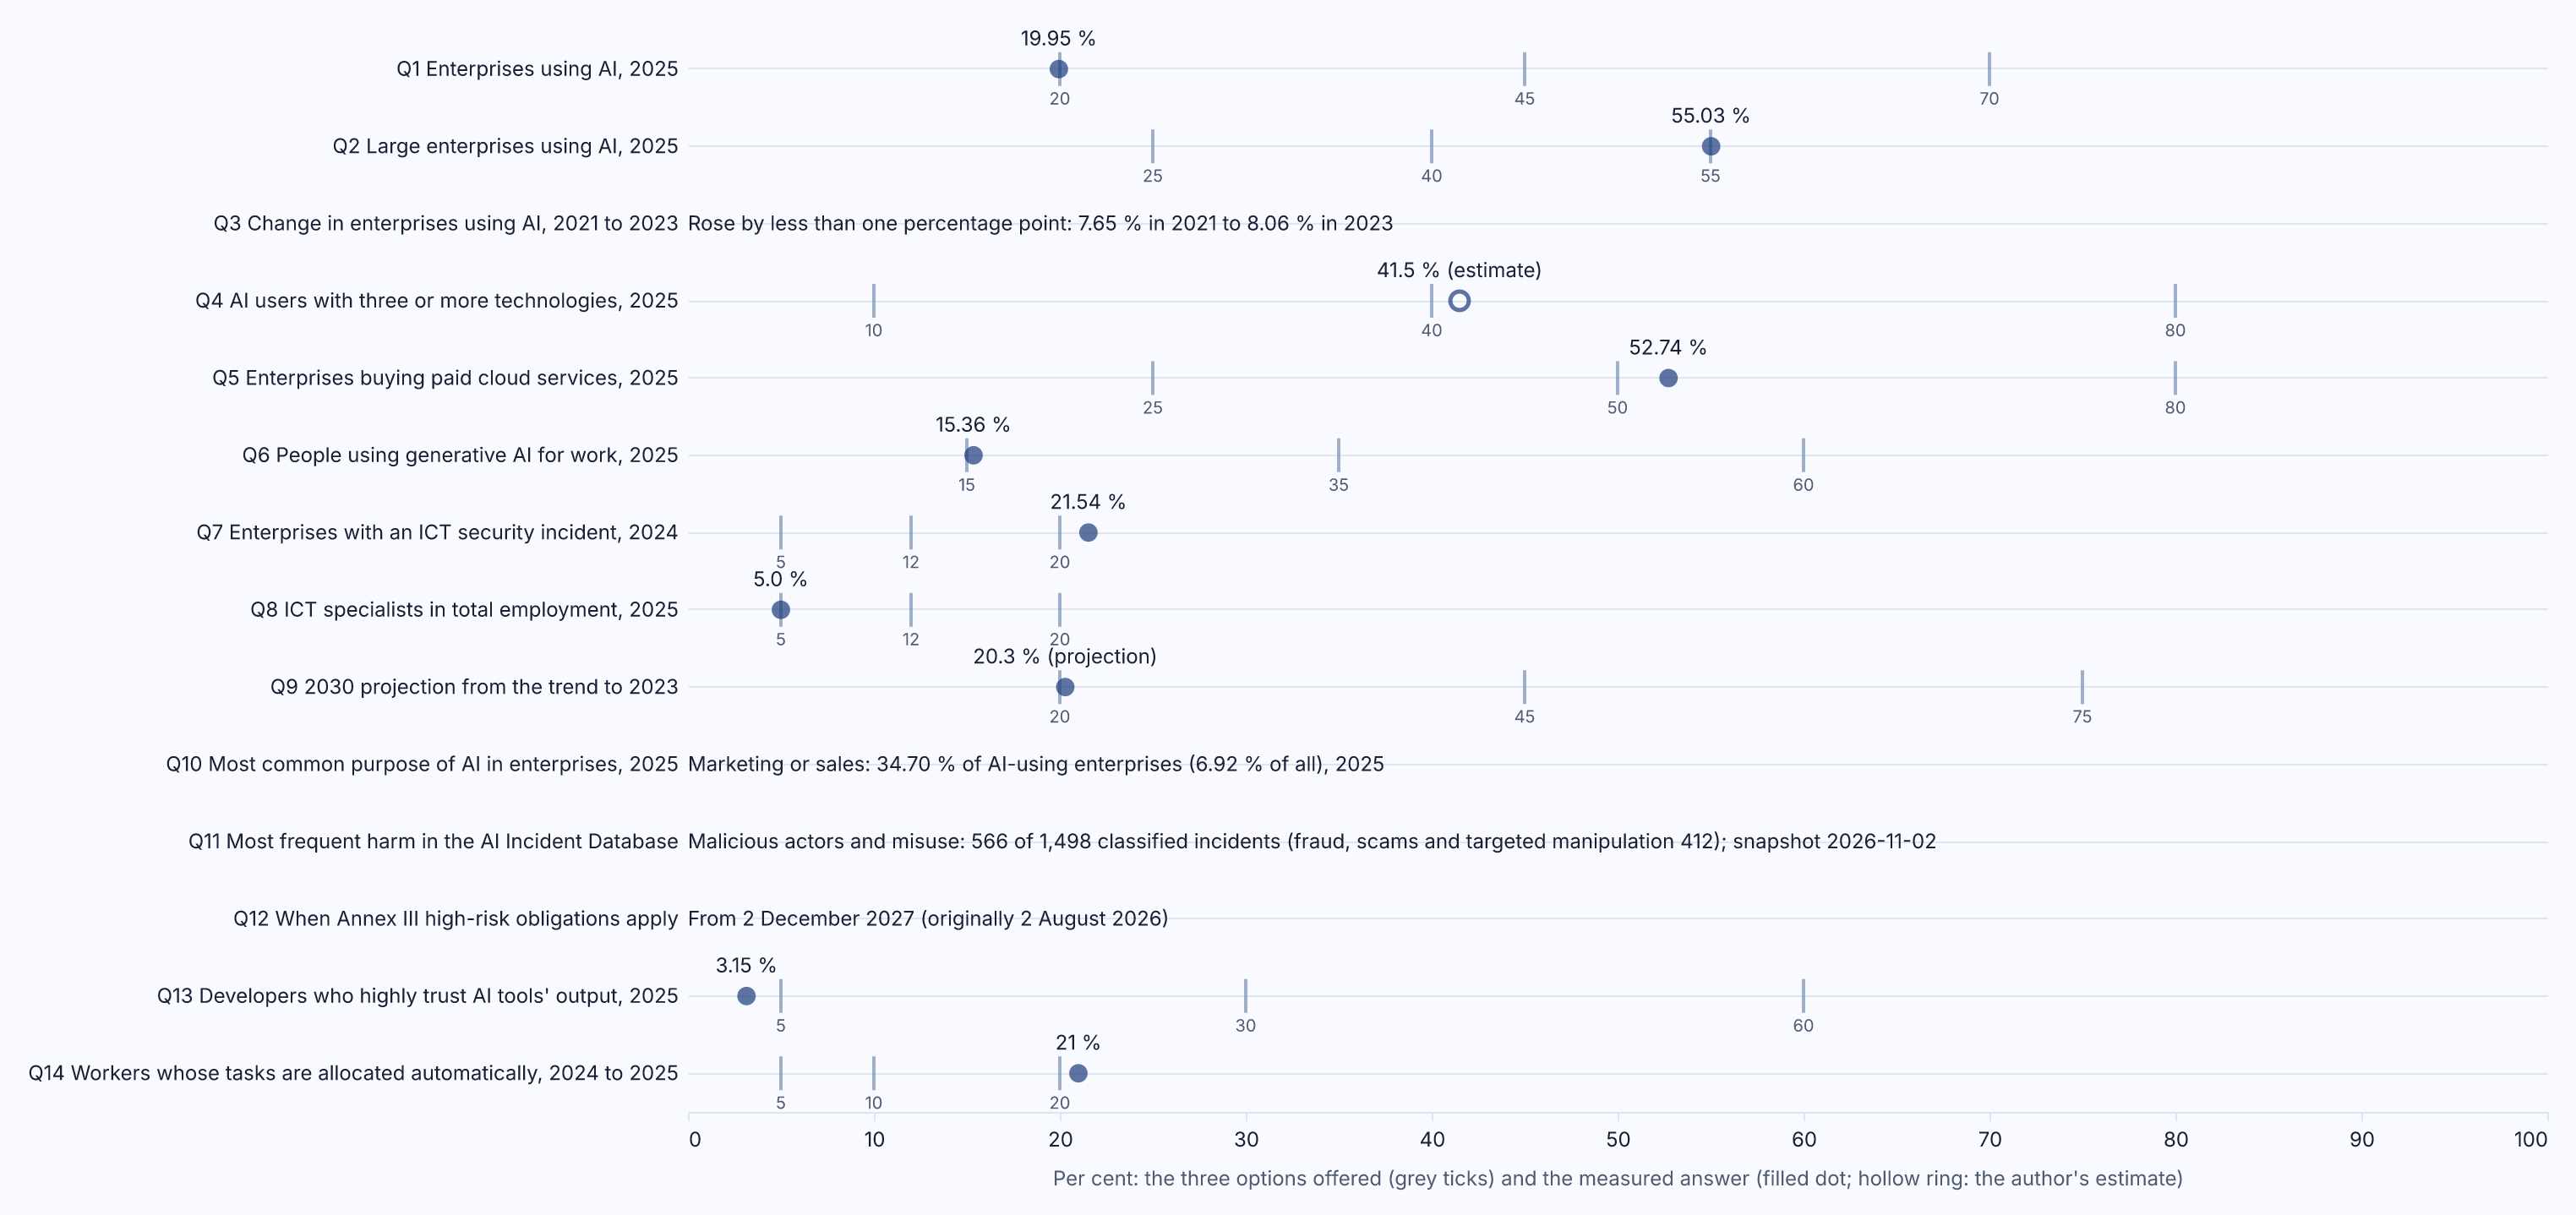
Figure 1.1: The fourteen measured answers on one page: for each question, the measured value or category, with, for the ten numeric questions, the three options marked as ticks; the value for Question 4 is the author's estimate from two published shares. Source: Eurostat, isoc_eb_ai, isoc_cicce_use, isoc_ai_iaiu, isoc_cisce_ic and isoc_sks_itspt (2021 to 2025 data); European Commission, Digital Decade DESI dashboard (2026); Responsible AI Collaborative, AI Incident Database (snapshot of 2 November 2026); Regulation (EU) 2026/1744; Stack Overflow Developer Survey 2025 (self-selected sample); European Commission Joint Research Centre, AIM-WORK survey 2025 (retrieved 2026).
Each answer below gives the figure, the year and the dataset, and points to the chapter that explains it in full. Where a published survey asked people a comparable question, I give how respondents answered next to the measured value. Where none did, the question is a self-test: your own answer is the only perception data there is.
Question 1: A, about 20 per cent. In 2025, 19.95 per cent of EU enterprises with ten or more employees, outside the financial sector, used at least one of the AI technologies on Eurostat's list (9, Eurostat, 2026). The list is the point: an enterprise counts if it uses any one of eight technologies, from text mining and speech recognition to autonomous machines and, from 2025, AI that generates pictures, video or sound. Self-test; Chapter 10.
Question 2: C, about 55 per cent. Among enterprises with 250 or more employees, 55.03 per cent used at least one AI technology in 2025, against 30.36 per cent of medium-sized and 17.0 per cent of small enterprises (9, Eurostat, 2026). The EU average in Question 1 is an average over a population in which small enterprises are the great majority. Self-test; Chapter 10.
Question 3: B, it rose by less than one percentage point. The share was 7.65 per cent in 2021 and 8.06 per cent in 2023; the survey module was not run in 2022 (9, Eurostat, 2026). It was 13.48 per cent in 2024 and 19.95 per cent in 2025, and the 2025 figure rests on a list of technologies one item longer. The curve was flat for longer than most of us remember. Self-test; Chapter 8.
Question 4: B, about four in ten. In 2025, 8.28 per cent of all EU enterprises with ten or more employees used three or more of the listed AI technologies, while 19.95 per cent used at least one (9, Eurostat, 2026). The ratio, about four in ten of the users, is my estimate and not a figure Eurostat publishes. Most enterprises that use AI use one or two kinds of it. Self-test; Chapter 5.
Question 5: B, about 50 per cent. In 2025, 52.74 per cent of EU enterprises with ten or more employees bought paid cloud computing services over the internet, up from 40.97 per cent in 2021 (10, Eurostat, 2026). Self-test; Chapter 5.
Question 6: A, about 15 per cent. In 2025, 15.36 per cent of people aged 16 to 74 in the EU had used a generative AI tool for work in the previous three months; 32.66 per cent had used one for any purpose (14, Eurostat, 2026). Two surveys asked something near it. The Joint Research Centre's AIM-WORK survey asked workers about any AI-powered tool in their main paid job in the last 12 months, a wider question over a longer period, and 29.9 per cent answered yes (51, Gonzalez Vazquez et al., 2025). In a vendor survey by Ipsos, 59 per cent on the average of 30 countries thought it very or somewhat likely that AI would change how they do their job within five years (31, Ipsos, 2025). Chapter 6.
Question 7: C, about 20 per cent. In the 2024 survey, 21.54 per cent of EU enterprises with ten or more employees reported an ICT security incident that made services unavailable, destroyed or corrupted data or disclosed confidential data, for any reason (11, Eurostat, 2026). Where services were made unavailable, the cause was mostly not attack: 17.97 per cent reported unavailability from a hardware or software failure and 3.43 per cent from an attack from outside such as ransomware; these two figures cover unavailability only. Self-test; Chapter 9.
Question 8: A, about 5 per cent. ICT specialists were 5.0 per cent of total employment in the EU in 2025, about 10.45 million people, both estimates by Eurostat (12, Eurostat, 2026). Self-test; Chapter 10.
Question 9: A, about 20 per cent. The Commission's dashboard publishes, with each year's report, a baseline: a trajectory to 2030 based on past performance. The 2023 edition of the baseline had a single observed value, 8.0 per cent for 2021 (the dashboard's figure, against 7.65 in Eurostat's own series in Question 3), and reached 20.3 per cent in 2030; the 2026 edition, drawn after two years of fast growth, reaches 54.3 per cent (15, European Commission, 2026). The target itself is 75 per cent: the dashboard sets it for AI alone, while Decision (EU) 2022/2481, Article 4(1), point (3)(a), sets it for enterprises that have taken up one or more of cloud computing, big data and AI (43, European Union, 2022). Which line you draw depends on which two years you draw it through. Self-test; Chapter 8.
Question 10: C, marketing or sales. In 2025, 6.92 per cent of all EU enterprises with ten or more employees used AI for marketing or sales, which is 34.7 per cent of those that used AI at all; business administration followed at 6.19 per cent, accounting or finance at 4.61, production at 4.14 and ICT security at 3.94 (9, Eurostat, 2026). Self-test; Chapter 5.
Question 11: B, people using AI to defraud, deceive or manipulate other people. The AI Incident Database, a public record of reported incidents in which AI systems caused or nearly caused harm, held 1,786 incidents in its snapshot of 2 November 2026, of which 1,498 carry a classification under the MIT AI Risk Repository taxonomy (35, Responsible AI Collaborative, 2026). The largest domain is "Malicious actors and misuse" with 566 incidents, 412 of them fraud, scams and targeted manipulation; the subdomain closest to option A, an AI system pursuing its own goals against human goals, has three. The counts measure what the press reported and the editors accepted, not all harm. Against them, 51 per cent of US adults said in 2024 that the increased use of AI made them more concerned than excited, as did 15 per cent of a separate sample of 1,013 AI experts (32, McClain et al., 2025), and 66 per cent of Europeans agreed in 2024 that more jobs would disappear than be created (29, European Commission, 2025). Chapters 7 and 9 take up the counts and their bias.
Question 12: B, from 2 December 2027. Regulation (EU) 2024/1689, the AI Act, first applied its obligations for the high-risk systems of Annex III from 2 August 2026 (39, European Union, 2024). Regulation (EU) 2026/1744, the Digital Omnibus on AI, in force since 27 July 2026, amended the third paragraph of Article 113 in its Article 1, point 40: the obligations of Chapter III, Sections 1, 2 and 3 apply from 2 December 2027 to systems classified as high-risk under Article 6(2) and Annex III, and from 2 August 2028 to those classified under Article 6(1) and Annex I (40, European Union, 2026). Those dates are observable, because they stand in adopted legislation; what they imply is a matter of planning, not legal advice. Self-test; Chapter 11.
Question 13: A, under 5 per cent. Of the developers who answered the 2025 Stack Overflow Developer Survey question, 3.15 per cent highly trust the accuracy of AI tools' output and 29.64 per cent somewhat trust it, while 78.49 per cent use the tools at least monthly (28, Stack Overflow, 2025). The survey is self-selected, answered by more than 49,000 people who chose to, so it is perception data about its own respondents and nothing wider. Chapter 6.
Question 14: C, about 20 per cent. In the AIM-WORK survey, with fieldwork from October 2024 to January 2025, 21 per cent of EU workers answered yes to whether a device such as a computer, tablet or smartphone automatically allocated their work tasks, and 24 per cent to the same question about rosters or shift hours (51, Gonzalez Vazquez et al., 2025). Eurobarometer asked in April and May 2024 whether digital technologies including AI had performed such activities in respondents' most recent workplace: 22 per cent answered yes, all the time or often, for allocating tasks and 29 per cent for managing worktime schedules (29, European Commission, 2025). Two surveys with different methods agree within a few points. Chapter 6.
Count your correct answers. Random choice would give about 4.7 of the fourteen. If you scored lower, you are in good company, and the next section is about why.
Why we get them wrong
The picture each of us carries of this landscape is assembled from what is loud, recent and close, which is how pictures get assembled.
Author's note needed: one real occasion, two or three sentences, on which your own estimate of AI use, risk or regulation in an organisation you worked with turned out to be far from the measured figure, and what corrected it. It belongs here, after the general statement and before the paragraph on instincts.
Rosling's point was that wrong answers of this kind are not ignorance. Ignorance would be random, and random scores one in three. Systematic misreading has a direction, and it comes from instincts that serve us well elsewhere: to see things in boxes, to assume a line keeps going, to attend to what frightens us, to look for someone to blame. This book names nine such instincts on this landscape, and Part II gives each a chapter, a measured picture and a rule of thumb.
Six of the nine names are Rosling's: the straight-line, fear, size, destiny, single-perspective and blame instincts are his, found in other data and applied here to different evidence (8, Rosling et al., 2018). The box and binary instincts are close relatives of his generalisation and gap instincts, and the model instinct has no counterpart in his list. What is the book's own is the evidence: which datasets show each instinct at work on this landscape.
The box instinct (Chapter 5) hears "a fifth of enterprises use AI" as one thing, when the dataset counts eight technologies and seven of them are used by fewer than one enterprise in ten (9, Eurostat, 2026); Questions 4, 5 and 10 belong to it. The binary instinct (Chapter 6) sorts work into automated and manual and misses the levels in between; Questions 6, 13 and 14. The model instinct (Chapter 7) takes the model, its name and its benchmark for the risk, when the use sets it; Questions 11 and 12. The straight-line instinct (Chapter 8) draws the trend through the two most recent points; Questions 3 and 9. The fear instinct (Chapter 9) attends to the loud harms and misses the quiet ones; Questions 7 and 11. The size instinct (Chapter 10) reads a number without its denominator; Questions 1, 2 and 8. The destiny instinct (Chapter 11) treats a date, a target or a trajectory as fixed; Questions 9 and 12. The single-perspective instinct (Chapter 12) looks at the landscape through one lens, security or compliance or productivity; Question 13. The blame instinct (Chapter 13) looks for a person to hold responsible when the deeper fault is that nobody designed who decides; Question 11. Several questions appear twice because one number can be misread by two instincts. Chapter 19 gives the full map. Naming the instincts is half the method; the other half is a picture that resists them.
A picture drawn the same way every time
Rosling's second instrument was a chart. Gapminder drew every country as a bubble, with income along one axis, length of life along the other, the bubble's size for population and its colour for region, and Rosling replaced the two boxes of "developed" and "developing" with four income levels drawn on that chart (8, Rosling et al., 2018). Because the axes, sizes and colours never changed, a reader who had learnt the chart once could read any year or country at a glance. This book uses none of Gapminder's data or imagery. I have borrowed the principle: fixed axes, sizes and colours, so that every picture of this landscape can be read the same way.
The book's notation is called Contour. It draws one unit, one way in which an organisation puts a model to work with the people who work with it, as one mark, and every mark carries the same things. Left to right is the autonomy level, what the AI may do without a person approving each action, on the five levels defined in AI Red Team, Chapter 6, from Level 0 Advisory, where the AI suggests and a person decides and acts, to Level 4 Autonomous, where it selects and executes actions without approval of each one (4, Nordqvist, 2026). Bottom to top is how hard the action would be to undo, from R1 Reversible at once to R4 Irreversible. Size is reach, the people the unit touches in a year, in four sizes from S to XL. Colour is the usage mode, how the organisation came to use the model, on the six modes defined in AI Governance, Chapter 2, from Mode 0 Ambient AI, features nobody chose, to Mode 5 Autonomous production agents, agents acting on business systems within a mandate (2, Nordqvist, 2026). Shape says whose identity the unit acts with: a circle for a person's, a rounded square for its own. A small diamond, the policy point, shows whether a control outside the model enforces what it may do. A small grey seat above the mark carries the tier of the person who holds the decision right and is absent where nobody is named. A short line beneath, the baseline, is solid where proof that the controls hold is produced automatically and dashed where it is declared by a person or a supplier. Chapters 3 and 4 teach all of this slowly. For now, look at two pictures without trying to read them fully.
Both pictures show fictional organisations, introduced below, on 1 January 2027. That date lies after the data of this book, retrieved in November 2026, so the pictures are a constructed scenario and not a forecast.
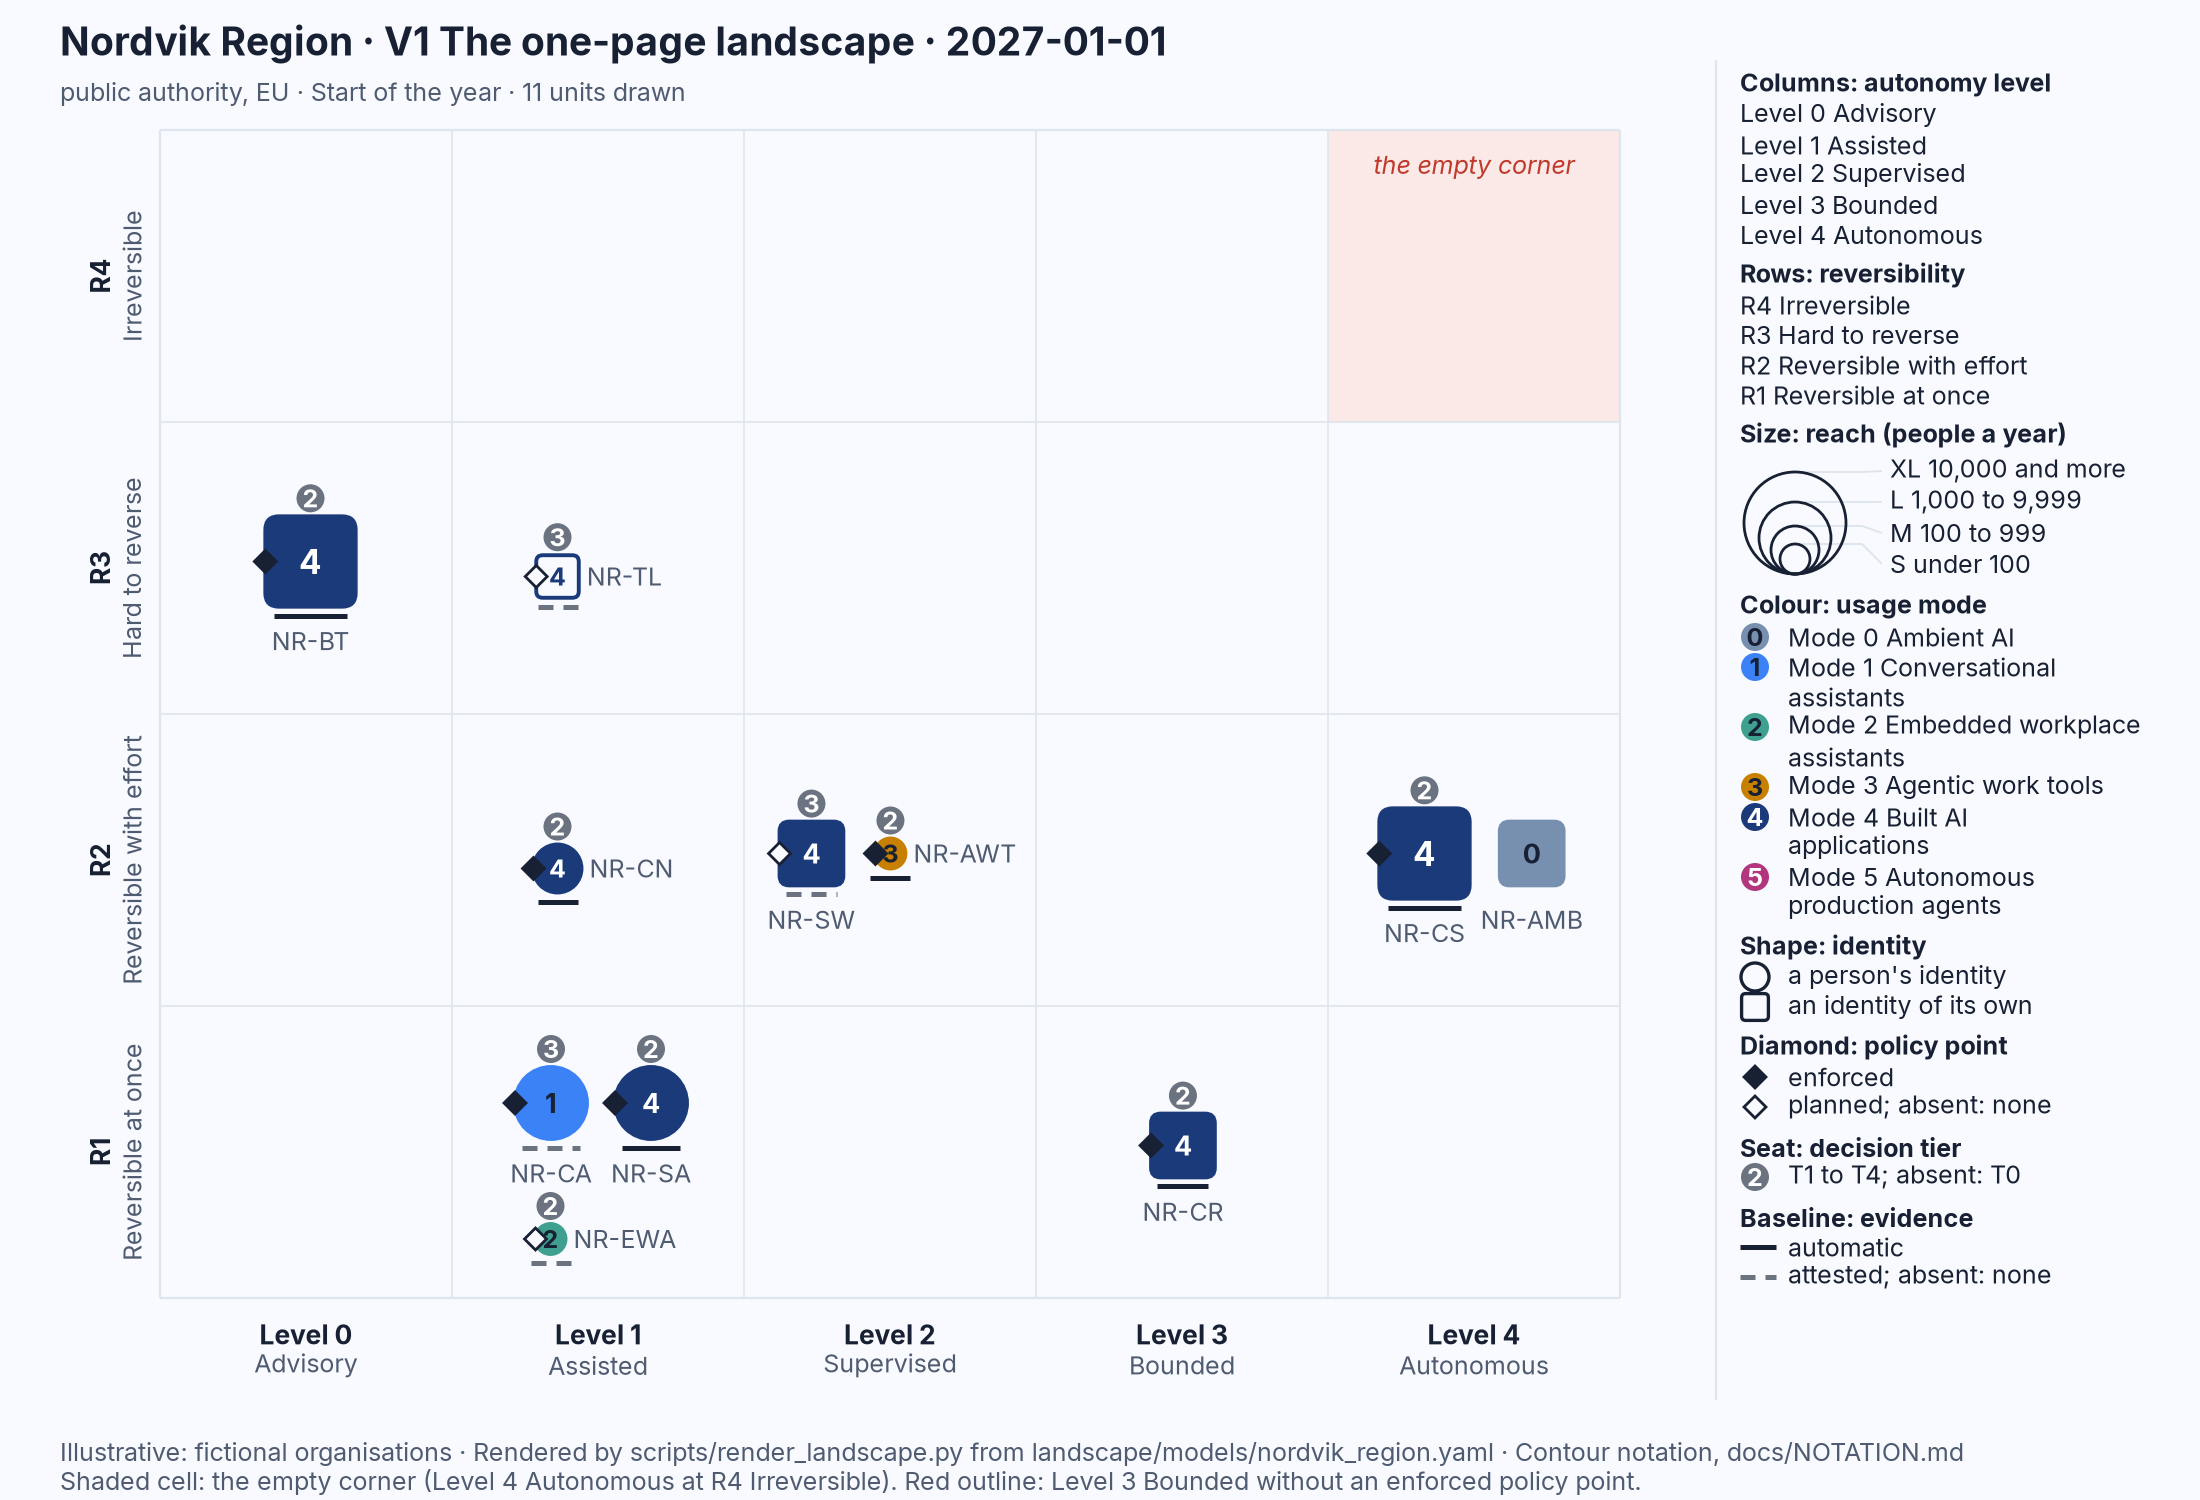
Figure 1.2: Nordvik Region's landscape on 1 January 2027, V1 the one-page landscape, eleven units drawn. Illustrative: rendered from landscape/models/nordvik_region.yaml.
This is Nordvik Region, a regional public authority (illustrative). The first thing to see is where marks are not: the shaded top-right cell, Level 4 Autonomous at R4 Irreversible, which the notation calls the empty corner, is empty. Most marks sit in the left two columns, where a person decides or reviews every action, and in the lower rows, where what the AI does can be undone. Two marks in the right-hand column tell the second story. The citizen-service assistant, which answers residents from published information, has a filled diamond, a seat and a solid baseline: a policy point limits what it may say, a named owner holds the decision right and the evidence is automatic. Beside it is a grey square with none of the three: Mode 0 Ambient AI, the AI features that software suppliers switched on inside licensed products, acting at a level the suppliers chose, with nobody at the Region named as deciding about them. Two marks at the same level, one governed and one unowned.
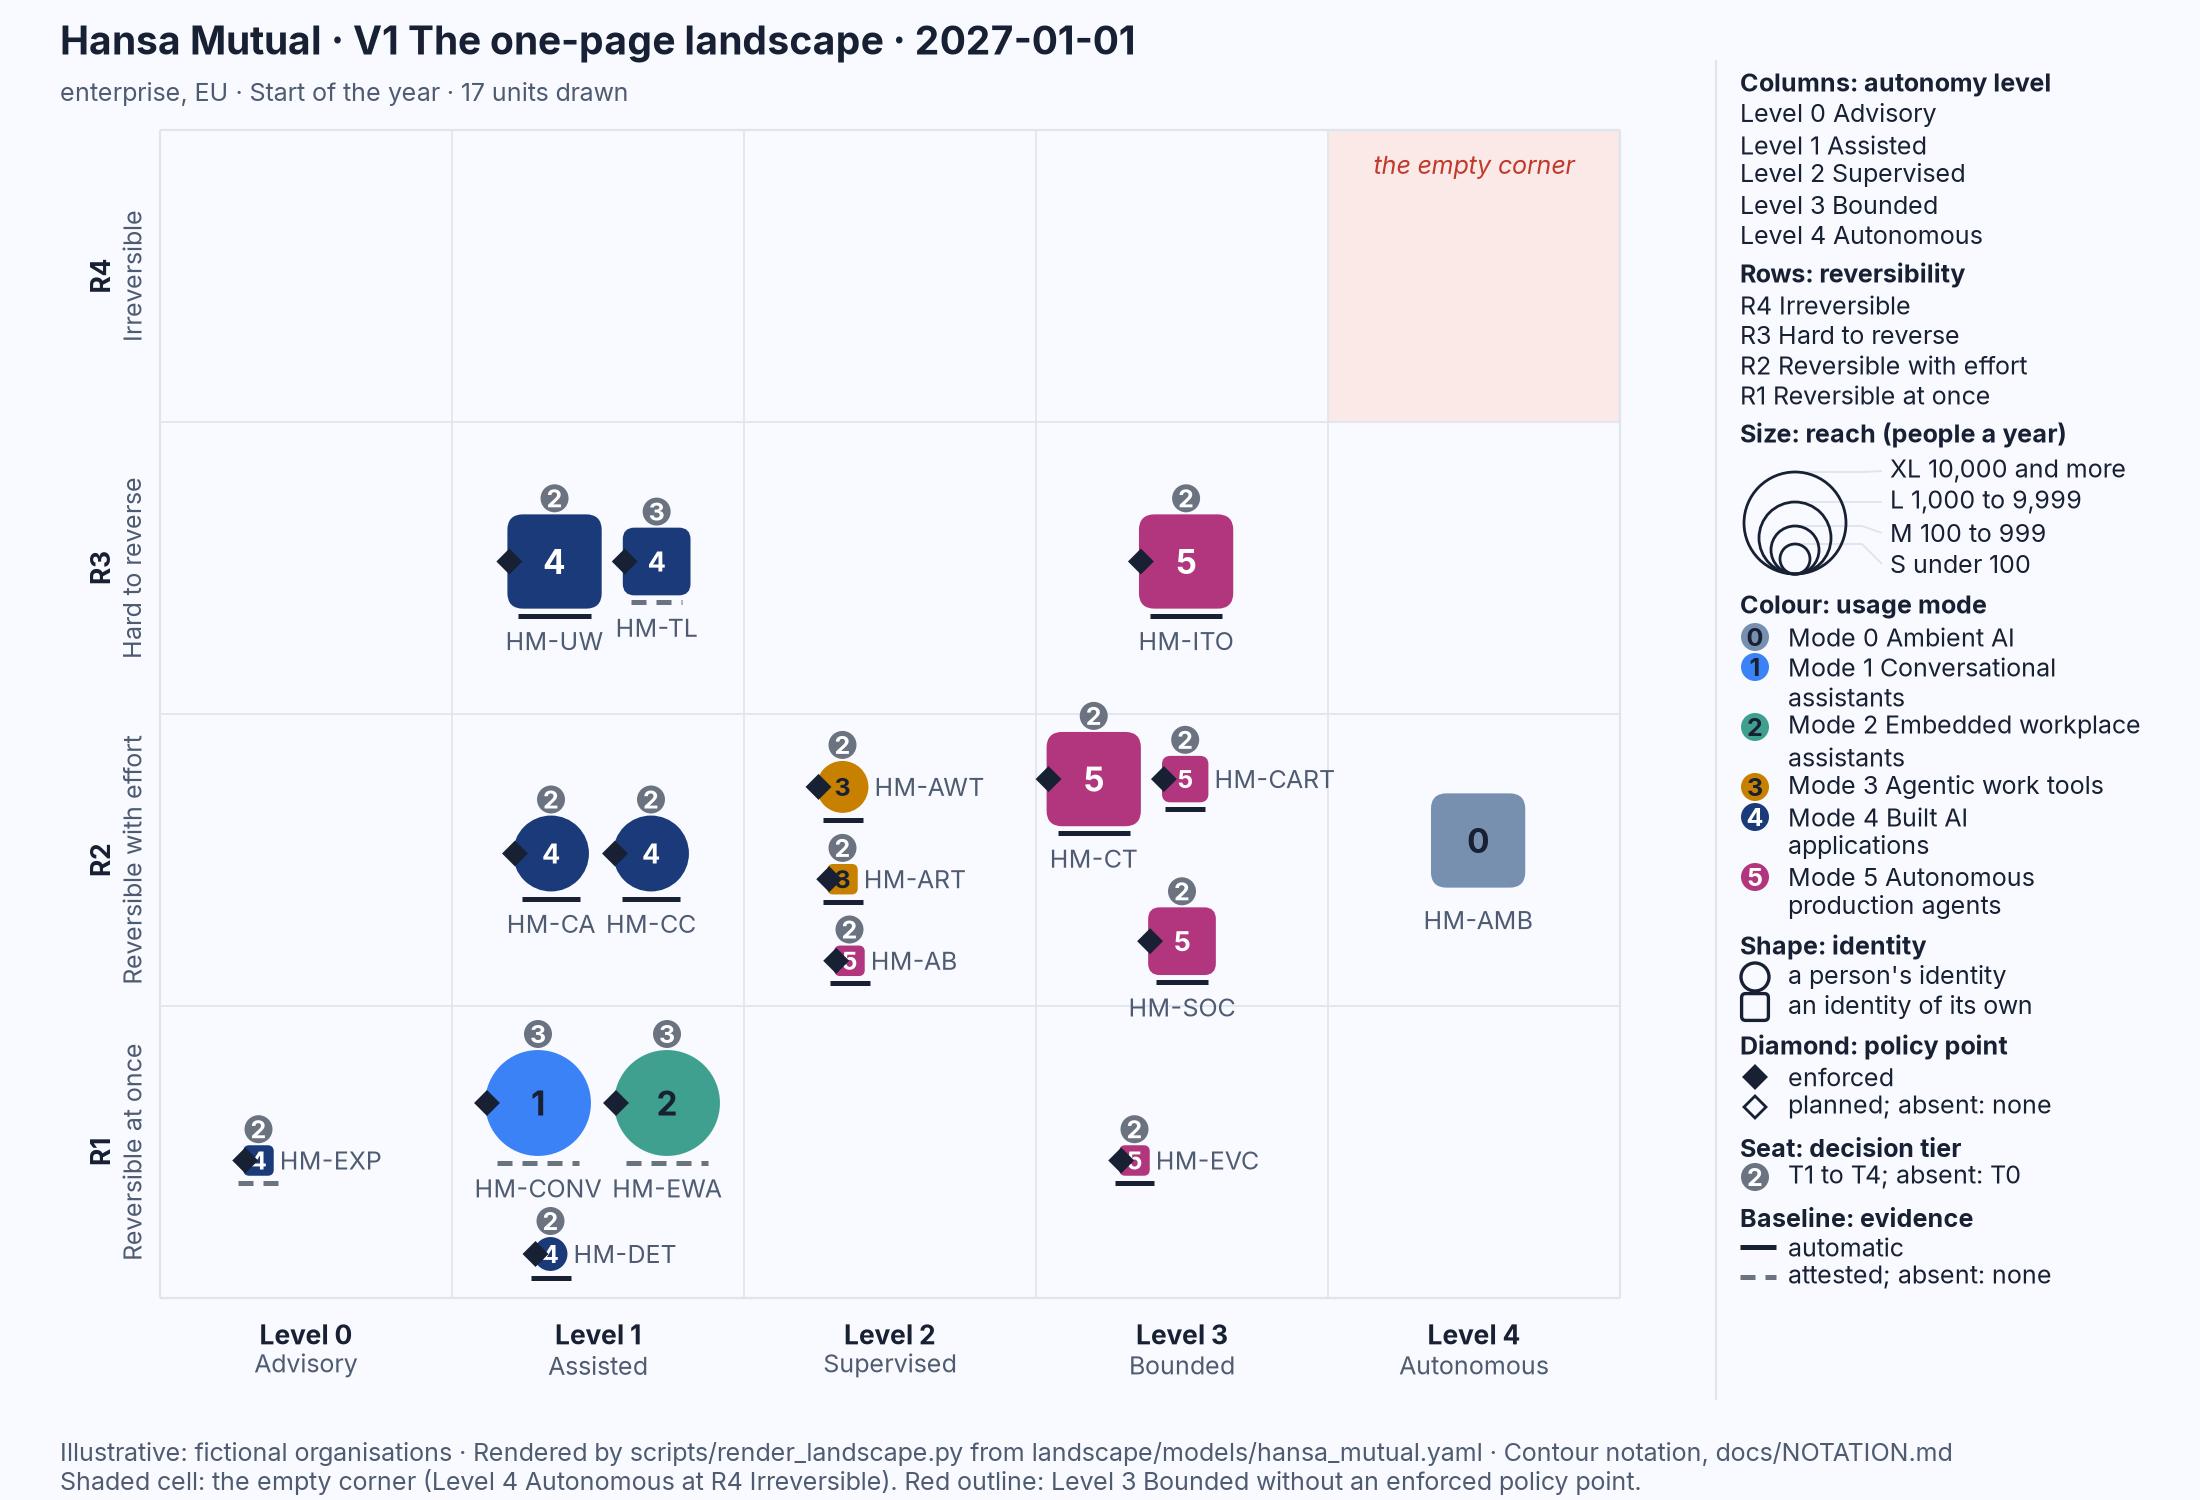
Figure 1.3: Hansa Mutual's landscape on 1 January 2027, V1 the one-page landscape, seventeen units drawn. Illustrative: rendered from landscape/models/hansa_mutual.yaml.
This is Hansa Mutual, an insurance group, at the same scales (illustrative). The eye goes to the six magenta squares, Mode 5, autonomous production agents acting with identities of their own within pre-approved playbooks: five in the Level 3 Bounded column and one at Level 2. Each has a filled diamond, a seat and a solid baseline. The largest circles sit in the bottom row at Level 1: the conversational and workplace assistants, which act with each employee's own permissions and reach ten thousand people or more, with dashed baselines because the proof of their controls is what the supplier and the tenant policy declare. At the right, as at Nordvik Region, is a grey square at Level 4 with no seat. Two organisations that look nothing alike in prose can be compared in thirty seconds when they are drawn the same way.
Younger, thinner data
There are two honest differences between Rosling's data and mine, and the book says so figure by figure.
The first is age and depth. Rosling drew on demographic series that statistical offices have kept for generations. The series behind this book are young. Eurostat's survey module on AI in enterprises has four points (2021, 2023, 2024 and 2025) and changed its list of technologies in 2025 (9, Eurostat, 2026); its question to individuals about generative AI tools has one year of data (14, Eurostat, 2026). The AI Incident Database was set up to catalogue incidents so that they are not repeated (50, McGregor, 2021), and its counts for earlier years are revised as reports arrive (35, Responsible AI Collaborative, 2026). The law was amended in 2026 before its main obligations had applied (40, European Union, 2026). Where a series has three or four points, I draw the points and not the line past the last of them.
The second is who produced the data. A great deal of what is published about AI at work comes from parties with an interest in the answer: vendors of AI products, consultancies that sell adoption, foundations that advocate caution. That does not make it false, but it changes how it must be read. The book grades its sources in five ranks and marks a vendor survey or a self-selected sample wherever one is used.
Official statistics come first: surveys run under statistical law by a statistical office, with a documented population, a published questionnaire and a known method, such as Eurostat's enterprise and household surveys and the Digital Decade indicators the Commission computes from them (15, European Commission, 2026). Probability surveys come second: surveys by public or academic bodies with a sampling frame and weights, such as Special Eurobarometer 554, which rests on 26,415 face-to-face interviews (29, European Commission, 2025), the Joint Research Centre's AIM-WORK survey and Pew Research Center's panels. Self-selected surveys come third: large and informative, but representative only of the people who chose to answer, such as the Stack Overflow Developer Survey; the book quotes them as perception data about their respondents, not as a share of a population. Incident databases come fourth: the AI Incident Database and the OECD's AI Incidents and Hazards Monitor (36, OECD, 2026) record what was reported, so their counts carry the selection of the press and of their editors, and a rise in a count may be a rise in attention. Vendor reports come fifth: a vendor's survey of its market, such as Microsoft's Work Trend Index of 31,000 knowledge workers (25, Microsoft, 2025) or Ipsos's self-funded AI Monitor, is quoted where nothing better exists and marked "vendor survey", with its sample and method where the vendor gives them.
The caption rules follow from the grades. Every data chart ends with the publisher, the dataset and the year it was retrieved. Every number in the prose carries a citation in its sentence or the one before. No figure is rounded beyond what the source gives, and no series is extended past its last point. An estimate is called an estimate and its method given. Every figure of the two fictional organisations carries the word "illustrative", because it is a drawing, not data. Appendix C lists every dataset.
The stance
I am a possibilist, in the sense Rosling gave the word: neither an optimist nor a pessimist, but someone who looks at the measured picture, sees the problems and the progress in it at the same time, and asks what can be done (8, Rosling et al., 2018). On this landscape that stance has a particular shape. The data do not support the loudest hopes: 19.95 per cent of enterprises, 55.03 per cent of large ones, 15.36 per cent of people using generative tools for work (9, Eurostat, 2026) (14, Eurostat, 2026). They do not support the loudest fears either: the most frequent recorded harm is people defrauding people, and the runaway system is three entries among the 1,498 classified incidents of a database of 1,786 (35, Responsible AI Collaborative, 2026). A count of reported incidents is weak evidence about a risk nobody has yet observed, and Chapter 9 says what it can and cannot show. What the data support is work: deciding who holds the seat above every mark, putting a policy point outside the model, producing evidence rather than collecting promises, and drawing the picture so that everyone in the organisation sees the same one.
Every statement about the future in this book carries one of three labels, which I take with attribution from AI Governance, Chapter 22 (2, Nordqvist, 2026). Observable means happening now and documented: in adopted legislation, published guidance or production systems. Expected means supported by a decided instrument or by evidence stronger than a line through two points, with uncertain timing or form. Speculation means plausible and consequential but not yet evidenced. The label appears in bold the first time a paragraph makes such a statement. A forecast by someone else is attributed and labelled. My own projections about the next years are confined to Chapter 20 and marked as my judgement there, so that a reader who wants only the measured picture can stop at Chapter 19.
One claim in this chapter needs its label now. That readers of this book, taken together, score below the one in three that random choice gives is speculation: it rests on the Gapminder results in another field (16, Gapminder Foundation, 2017), and nobody has put these fourteen questions to a sample with a stated method. Appendix C says so.
Two organisations
Two fictional organisations walk through every chapter of this book, as they do through the AI volumes of The Transformed Architecture. They are drawn so that the reader can see the landscape in a recognisable place; they are not evidence of anything, and no figure of either is a data chart. Every picture of them is rendered from a landscape model, so that it is exact and the same in every chapter. What the book says of their year 2027 is a scenario built from those models, told once in Chapter 18, and is not a forecast.
Nordvik Region is a regional public authority in a Nordic member state of the European Union. It coordinates regional health and social care, runs regional development and public transport, and administers needs-based financial assistance on behalf of its municipalities. It has about 6,000 employees and serves about 450,000 residents. It lives in one jurisdiction and under public law: a deployer of high-risk AI systems in the AI Act's sense, bound by the GDPR, by national administrative law with its duty to give reasons, and by public procurement law. It is cautious, accountable to elected politicians and the public, short of budget and specialist skills, and dependent on suppliers. Its advantages are a single legal regime, a clear public mandate and a tradition of openness; its disadvantages are limited engineering capacity, long procurement cycles and exposure to supplier lock-in.
Hansa Mutual is a mutual insurance group headquartered in Hamburg, Germany, writing property and casualty, motor and, in some markets, life and supplementary health insurance. It has about 9,500 employees and operates in seven countries: Germany, the Netherlands, Sweden and Poland inside the European Union, Norway in the European Economic Area, and the United Kingdom and Switzerland outside both. Its landscape model records about two million people served. It is provider and deployer of its own systems built on vendor models and runs autonomous agents on its core systems. Its difficulty is the differences: one AI Act and one GDPR applied by several national supervisors, works councils with different rights in each country, and two subsidiaries, in the United Kingdom and Switzerland, where the AI Act does not apply directly. Where Nordvik Region's question is usually whether it may, Hansa Mutual's is usually in which of seven ways it must. They were chosen because they fail in different directions: a cautious authority that buys most of its systems and an engineering-led insurer that builds its own show the same instincts from opposite sides.
Nordvik Region and Hansa Mutual
Imagine the one-page landscape of each handed to the organisation's leader without commentary, Figure 1.2 to the regional director and Figure 1.3 to a member of the executive board (illustrative). The director sees a grey square at Level 4 with no seat and can ask who decides about it. The board member sees magenta squares at Level 3 with write access to production and can ask how long it takes to stop one. Neither question needs the notation explained; the picture asks it. Chapter 4 explains the pictures, and Chapter 18 tells the two organisations' year.
How to read this book
The book has four parts. Part I, this chapter and the three that follow, gives the test, the old pictures with which the landscape is usually drawn and why they mislead (Chapter 2), the new landscape of who acts, with whose identity and under whose decision (Chapter 3), and the notation (Chapter 4). Part II, Chapters 5 to 13, takes the nine instincts one at a time, each with its questions, its evidence, its corrected picture and its rule of thumb. Part III, Chapters 14 to 18, is practical: how to draw your own organisation's landscape, how to read it over a year, where it runs and under which jurisdiction, who decides and how you know, and a year at the two organisations compared. Part IV collects the rules of thumb (Chapter 19) and ends with the next years and a conclusion (Chapter 20), the only place where my own projections appear.
If you are an executive or a board member, read Part I, then the rule of thumb and the "For an executive" section of each chapter in Part II, then Chapters 17 and 19. You will be able to ask, of any AI proposal, at which level it acts, how reversible its actions are, who holds the seat, and whether the evidence is automatic or a promise. If you are an architect or an engineer, read Parts I to III; Chapter 14 shows how to populate a landscape model, and Appendix A carries the reference card and the schema. If you are an elected official or a public servant, read Part I, Chapters 9, 11, 12 and 13, and Chapters 16 and 17: jurisdiction, supply, decision rights and evidence are the matters a public authority answers for to the public. If you are a journalist, read Parts I and II and keep the caption rules of this chapter beside you; the most useful habit the book can give you is to ask, of any number about AI, who produced it, over what population, and what the denominator is. If you are a citizen who wants to know what is being decided about you and by whom, read Chapters 1, 3, 6, 13 and 17, and the glossary. None of these paths requires the seven volumes of the series: every concept the book adopts from them is defined here before it is used, and the volumes are cited as earlier works by the same author.
Summary
This chapter opened the book as Rosling opened his, with a test to be taken before reading on: fourteen questions about the landscape that appears when architecture becomes code and AI goes to work in European enterprises and public authorities, each with three options and each answered from a public dataset. The measured answers are lower, flatter, quieter and later than the picture most of us carry: 19.95 per cent of enterprises using AI in 2025, a rise of less than a percentage point between 2021 and 2023 before the curve bent, 15.36 per cent of people using generative tools for work, fraud rather than runaway systems as the most frequent recorded harm, and obligations for high-risk systems that apply from 2 December 2027 (9, Eurostat, 2026) (14, Eurostat, 2026) (35, Responsible AI Collaborative, 2026) (40, European Union, 2026).
I argued that wrong answers are not ignorance but instincts, nine of them, each useful elsewhere and each misleading here, six of them named by Rosling. I introduced the notation, Contour, which draws every AI use as one mark, the same way every time, and showed two one-page landscapes as a first glance. I stated the two honest differences from Rosling's data, that the series are younger and thinner and more often produced by interested parties, and the five grades of source and the caption rules the book uses to say so.
The stance is possibilist: the data support neither the loudest hopes nor the loudest fears, and they support work. Every statement about the future carries the label observable, expected or speculation, and my own projections are confined to Chapter 20. The claim that readers score below chance on this test is itself labelled speculation until someone measures it.
Nordvik Region and Hansa Mutual walk through every chapter as illustrative landscapes rendered from a model, never as evidence, and their year 2027 is a scenario and not a forecast. Chapter 2 turns to the old pictures, the boxes, binaries and clouds with which this landscape is usually drawn, and to why each of them hides what the test just showed.
Sources
- Nordqvist, G. (2026). AI Governance: Governing Artificial Intelligence in European Enterprises and Public Authorities. aig.geon.se. (2, Nordqvist, 2026)
- Nordqvist, G. (2026). AI Red Team: AI as an Active Part of Cyber Defence in European Enterprises and Public Authorities. aired.geon.se. (4, Nordqvist, 2026)
- Rosling, H., Rosling, O. and Rosling Rönnlund, A. (2018). Factfulness: Ten Reasons We're Wrong About the World – and Why Things Are Better Than You Think. London: Sceptre. (8, Rosling et al., 2018)
- Eurostat (2026). Artificial intelligence by size class of enterprise. Online data code isoc_eb_ai. (9, Eurostat, 2026)
- Eurostat (2026). Cloud computing services by size class of enterprise. Online data code isoc_cicce_use. (10, Eurostat, 2026)
- Eurostat (2026). Security incidents and consequences by size class of enterprise. Online data code isoc_cisce_ic. (11, Eurostat, 2026)
- Eurostat (2026). Employed information and communications technology (ICT) specialists. Online data code isoc_sks_itspt. (12, Eurostat, 2026)
- Eurostat (2026). Individuals - use of generative AI tools. Online data code isoc_ai_iaiu. (14, Eurostat, 2026)
- European Commission, Directorate-General for Communications Networks, Content and Technology (2026). Digital Decade DESI dashboard: Digital Decade EU-level trajectories and Digital Economy and Society Indicators. (15, European Commission, 2026)
- Gapminder Foundation (2017). Gapminder Misconception Study 2017. (16, Gapminder Foundation, 2017)
- Microsoft (2025). 2025: The year the Frontier Firm is born. Work Trend Index Annual Report (vendor survey). (25, Microsoft, 2025)
- Stack Overflow (2025). 2025 Stack Overflow Developer Survey. Stack Exchange Inc. (28, Stack Overflow, 2025)
- European Commission, Directorate-General for Employment, Social Affairs and Inclusion (2025). Artificial Intelligence and the future of work. Special Eurobarometer 554. (29, European Commission, 2025)
- Ipsos (2025). The Ipsos AI Monitor 2025: A 30-country Ipsos Global Advisor Survey (vendor survey). (31, Ipsos, 2025)
- McClain, C., Kennedy, B., Gottfried, J., Anderson, M. and Pasquini, G. (2025). How the U.S. Public and AI Experts View Artificial Intelligence. Pew Research Center. (32, McClain et al., 2025)
- Responsible AI Collaborative (2026). AI Incident Database. Snapshot of 2 November 2026. (35, Responsible AI Collaborative, 2026)
- Organisation for Economic Co-operation and Development (2026). AIM: AI Incidents and Hazards Monitor. OECD.AI Policy Observatory. (36, OECD, 2026)
- European Parliament and Council of the European Union (2024). Regulation (EU) 2024/1689 (Artificial Intelligence Act). Official Journal of the European Union. (39, European Union, 2024)
- European Parliament and Council of the European Union (2026). Regulation (EU) 2026/1744 (Digital Omnibus on AI). Official Journal of the European Union. (40, European Union, 2026)
- European Parliament and Council of the European Union (2022). Decision (EU) 2022/2481 establishing the Digital Decade Policy Programme 2030. Official Journal of the European Union. (43, European Union, 2022)
- McGregor, S. (2021). Preventing Repeated Real World AI Failures by Cataloging Incidents: The AI Incident Database. Proceedings of the AAAI Conference on Artificial Intelligence, 35(17). (50, McGregor, 2021)
- Gonzalez Vazquez, I., Fernandez Macias, E., Wright, S. and Villani, D. (2025). Digital Monitoring, Algorithmic Management and the Platformisation of Work in Europe. European Commission, Joint Research Centre, JRC143072. (51, Gonzalez Vazquez et al., 2025)