The Landscape Over a Year: Reading Change
Put two pictures of the same organisation side by side, one drawn on the first day of a year and one on the last, and most of what you see is the same. That is as it should be: a landscape that changed everywhere in twelve months would be a landscape nobody governed. The skill this chapter teaches is to find the few things that moved, to tell them from the things that only look as if they moved, and to notice what changed without moving at all.
The scenario of Chapter 18 gives Nordvik Region a quiet year (illustrative). On 1 January 2027 its landscape holds eleven marks; on 31 December it holds thirteen. Two marks change column, two appear, one is retired, and several change something no trail can show: who sits in the seat above them, whether the diamond is filled, whether the baseline is solid or dashed. Hansa Mutual's year is quieter still on the page, seventeen marks on both dates and not one of them moved; yet its executive board takes over a decision right and the group's ambient AI acquires a named owner for the first time. Change is read from the trails, and then from everything the trails leave out.
This chapter teaches the time frame of the notation, the view called V2 The landscape over time: what a trail is and is not, how a unit drifts between usage modes, how reversibility decays, how new and retired marks are drawn, and how to label anything said about the year to come as observable, expected or speculation. It ends with a quarterly routine and five questions to ask of the trails.
Two dates
The notation draws change as a trail: a hollow outline of the mark at its earlier position, a thin line in the mark's colour, and the filled mark at its later position, with the two dates in a strip under the view. A mark that appeared during the period carries a small tick and the word "new" beside its label. A mark that was retired is drawn hollow, with a cross through it, where it last stood. No more than two dates are drawn in one view: a year is drawn as its start and its end, and the chapter that shows it says what happened between. Everything else, the columns, rows, colours, sizes, shapes, diamond, seat and baseline, is as in the one-page landscape of Chapter 14.
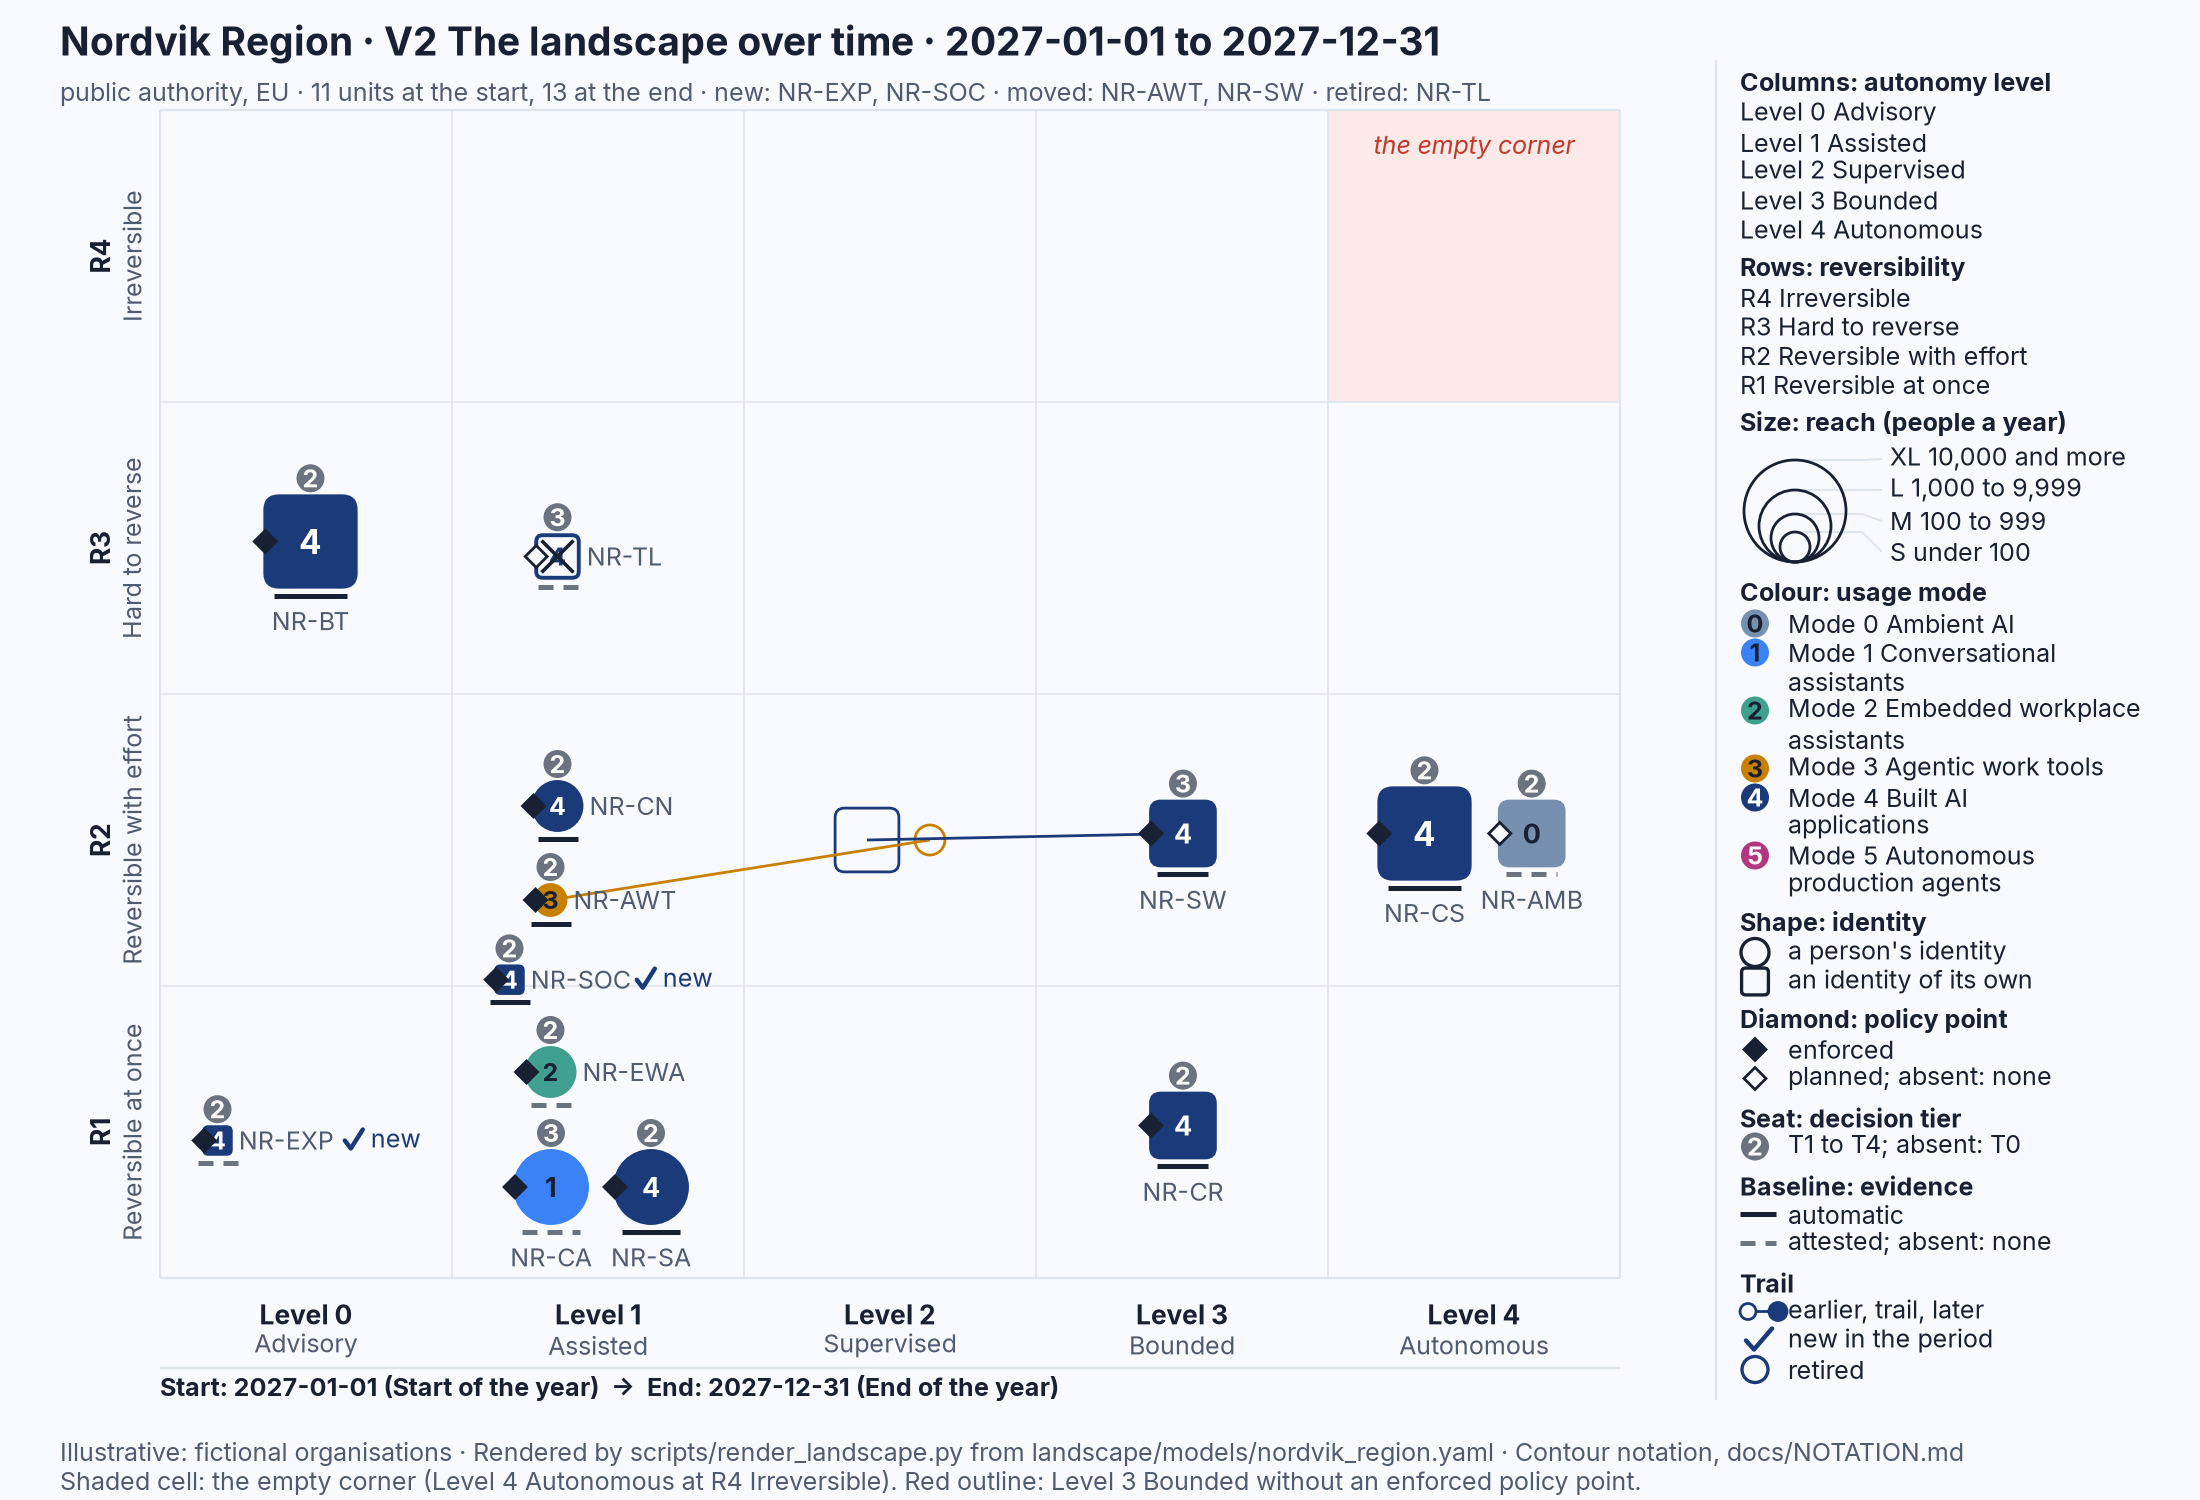
Figure 15.1: Nordvik Region's landscape over the year 2027, V2: two trails, two new marks and one retired mark on the autonomy by reversibility grid. Illustrative: rendered from landscape/models/nordvik_region.yaml.
Read Figure 15.1 as the thirty-second routine of Chapter 4 reads any landscape, with one step added at the front: look for the hollow outlines first, because each is a place a mark has left. There are two, both in the Level 2 Supervised column, row R2 Reversible with effort. The navy trail runs right, to NR-SW, the rostering and shift-allocation system, which ends the year at Level 3 Bounded; the amber trail runs left, to NR-AWT, the platform team's agentic work tools, which end it at Level 1 Assisted. One unit is allowed to do more without a person approving each action, and one is allowed to do less.
The most important thing to understand about a trail is what it does not draw. A trail is drawn for a change of column or row and for nothing else. A change of colour, size, shape, diamond, seat or baseline is shown as it stands at the later date, and the reader finds it by holding the later picture against the earlier one. The idea of V2 is movement on the grid, and in a quiet year the changes that matter most are often the ones a trail cannot show.
A year in the data
Before reading more of the two organisations, it helps to see what a year of change looks like when it is measured rather than drawn. Question 3 of the test asked how the share of EU enterprises using AI changed between 2021 and 2023; Chapter 8 gives the answer and names the instinct behind the common mistake. The figures this chapter needs are Eurostat's: 7.65 per cent of enterprises with ten or more persons employed used at least one of the listed AI technologies in 2021 and 8.06 per cent in 2023, then 13.48 per cent in 2024 and 19.95 per cent in 2025 (9, Eurostat, 2026). A line drawn through the first two dates says nothing about the last two.
Figure 15.2 opens the last of those years by Member State: a pale dot for 2024, a dark dot for 2025, and the year between them.
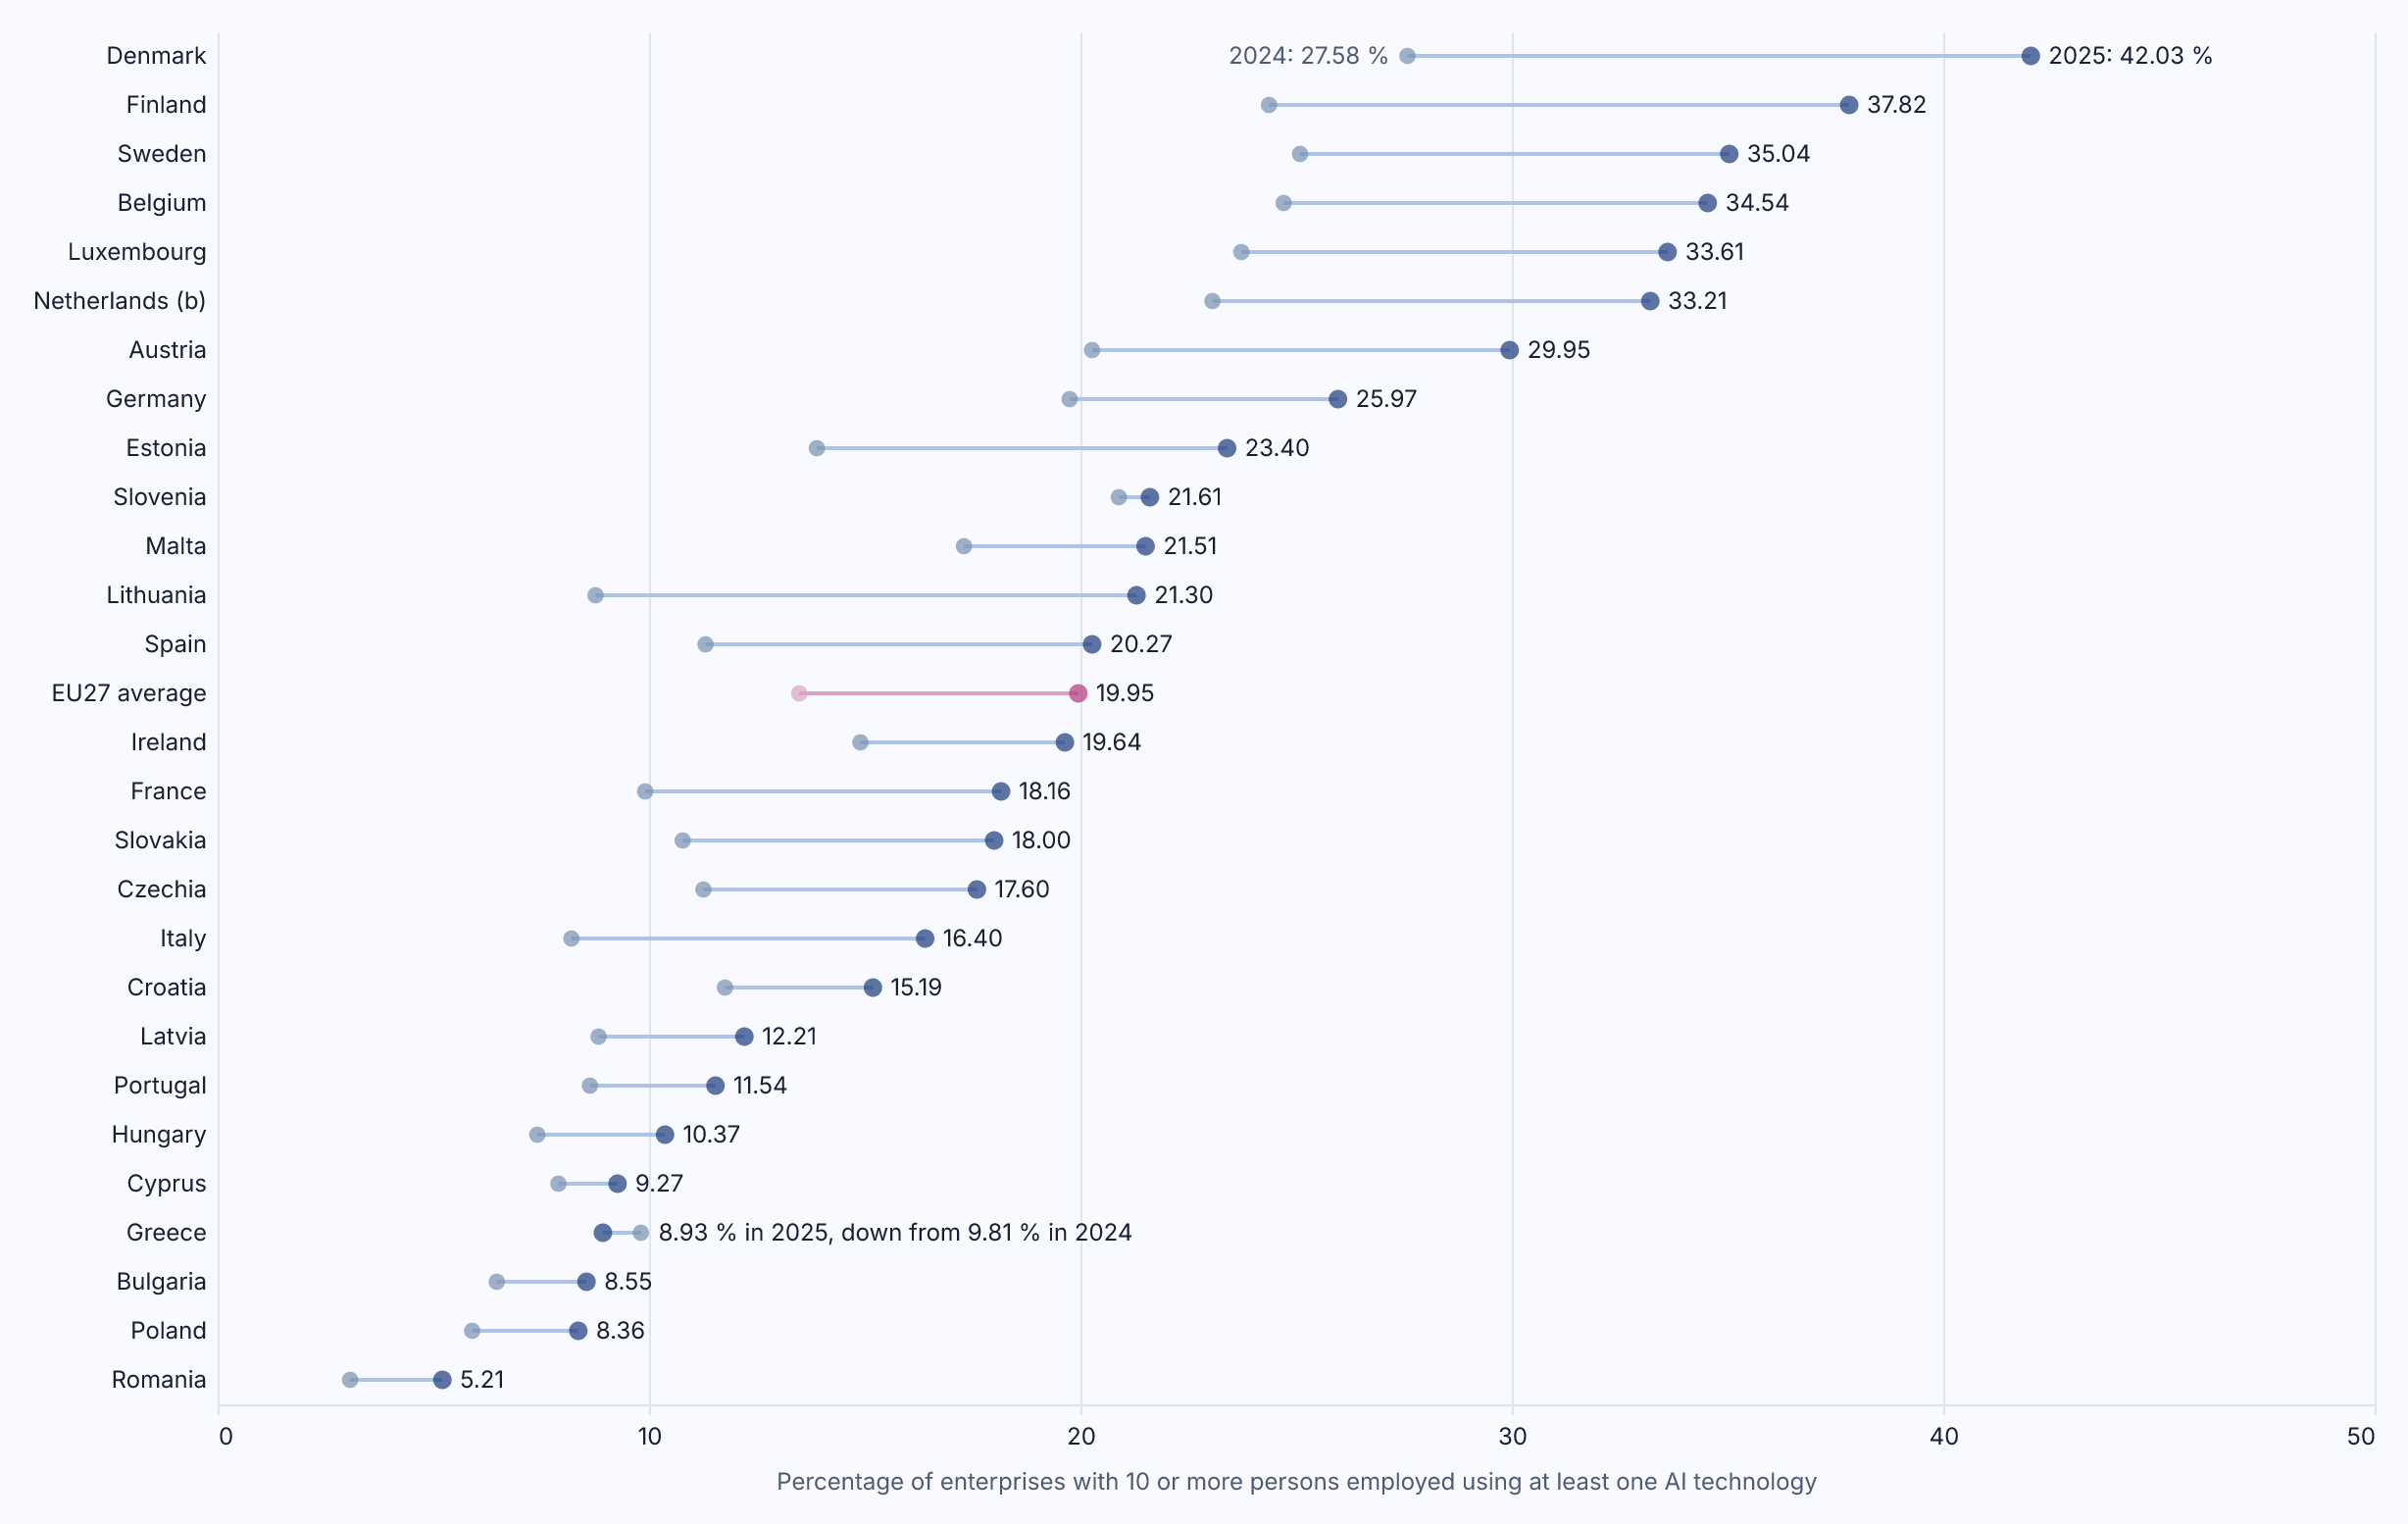
Figure 15.2: The one-year change from 2024 to 2025 in the share of enterprises with ten or more persons employed using at least one AI technology, by EU Member State, with the EU27 average; the Netherlands' 2025 value carries Eurostat's break-in-series flag. Source: Eurostat, isoc_eb_ai (retrieved 2026).
Three things can be read off the chart. First, almost every line runs the same way: 26 of the 27 Member States reported a higher share in 2025 than in 2024, and only Greece reported a lower one, 8.93 per cent against 9.81 (9, Eurostat, 2026). Second, the lines are of very different lengths: Denmark moved from 27.58 to 42.03 per cent and Lithuania from 8.76 to 21.3, while Slovenia moved from 20.89 to 21.61 and Romania from 3.07 to 5.21 (9, Eurostat, 2026). The same survey and the same question produce trails that range from barely a step to more than fourteen points. Third, one trail is not quite what it looks like. The Netherlands' 2025 value, 33.21 per cent against 23.06 the year before, carries Eurostat's flag for a break in the time series: the way the figure was collected or defined changed between the two dots, so part of the line may be a change in the measure rather than in the enterprises (9, Eurostat, 2026). The dataset adds a wider caution: the 2025 indicator counts an enterprise as using AI if it uses at least one of eight listed technology types, and the eighth, AI that generates pictures, video or sound, was asked for the first time in 2025 (9, Eurostat, 2026).
A trail is only as honest as the two measurements at its ends. If the question, the scale or the assessor changed between the dates, the line is partly an artefact. The notation cannot protect a reader from that; the model's timeline notes, which record who changed what and why, can. A trail with no note behind it is the first thing to ask about.
Drift
Drift in the statistical sense, the data a model sees in production moving away from the data it was built on, is not drawn by the notation. The drift this chapter is about is the drift of a unit between usage modes, the conclusion of AI Governance, Chapter 2: a use drifts from a prompt to a shared skill, to a product, to an automation, while the controls stay where the use started. Governance therefore attaches to the use and not to the tool, and every change of mode is a change event that calls for review (2, Nordqvist, 2026).
In the notation, mode is colour. A unit that drifted from Mode 1 Conversational assistants to Mode 3 Agentic work tools would change from the blue of Mode 1 to the amber of Mode 3, and in practice it would also move right, because an agentic tool executes what an assistant only suggested. The colour of the hollow outline is the mode the unit had; the colour of the filled mark is the mode it has. Then look at what travelled with the mark. If the controls stayed where the use started, the unit arrives in its new column with the diamond, seat and baseline of the old one: an acceptable-use policy and a signed form, brought to Level 3. A Level 3 Bounded mark whose diamond is hollow or absent is drawn with a thin red outline, because a Level 3 capability without a policy point outside the model is Level 4 with a misleading label. On V2 that red outline at the end of a trail is the picture of drift with the controls left behind.
Neither trail in Figure 15.1 shows it (illustrative). NR-SW's trail ends in a mark with a filled diamond, a T3 seat and a solid baseline, and the model's timeline says why: the policy point is enforced on 20 January, when the delegation profile for the rostering system is agreed with the unions, and the move to Level 3 comes on 11 March, when travel-time and rest constraints are made hard constraints and open-shift offers are allowed within the profile. The controls arrive first and the level follows seven weeks later. NR-AWT's trail the other way, on 1 May, aligns the platform team's mandate with the ceiling that the security architect's role charter set. Drift with the controls left behind is absent from both models, and I did not add it, because the two organisations illustrate what the series recommends rather than what it warns against. Look for it first in the colours.
Decay
The second movement is slower and harder to see, because it happens in the rows and nobody decides it. A unit's row is its reversibility as assessed when it was drawn, and the temptation at every later date is to copy it forward. AI Boss, Chapter 33, concludes that reversibility decays within months of go-live, not years, and that a register of delegations is valuable only if its reversibility tests check whether each delegation can still be undone; it draws the conclusion from the illustrative year of its two fictional organisations, and says that the decay is illustrated, not measured (7, Nordqvist, 2026). AI Threat, Chapter 26, describes the mechanism: small delegations erode skill, process, capacity, interfaces and memory until the documented fallback no longer exists; the test is whether the organisation could perform the function without the system for a defined period, and a failed test freezes further delegation (5, Nordqvist, 2026).
On the landscape, decay is a mark whose row should have moved up and did not. A rostering system is R2 Reversible with effort in January because a unit manager could, with effort, plan a roster by hand. If by December nobody has planned one by hand for eleven months, the honest row is R3 Hard to reverse. No change event fires, the mark does not move, and a re-render that reads the tier from last quarter's file draws it in R2 for ever. Decay is the one movement the model cannot show unless somebody measures it, and the measurement is a period of doing the work without the system, not a review of documents.
The two organisations show the shape of the answer (illustrative). At Nordvik Region the open-shift class has already moved to Level 3 on 11 March when the reversibility test of the rostering delegation runs, from 5 to 16 April 2027: the Strandvik unit plans its routes by hand for two weeks. The deputy has never planned a route by hand, the manual template lacks the travel-time rule, and the wards' competence rules cannot be exported from the supplier's product. The test passes with conditions, which are met on 30 June, and the supplier's shift-swap feature stays frozen; the Region's managerial craft programme, which reserves a week a month of hand-planned routes for the deputy of each home-care unit, is the remedy for the finding. At Hansa Mutual the equivalent test of the claims-triage agent runs from 15 to 19 March: the deputy needs three times as long to allocate claims as the team leader, and complex claims gather on four handlers. The test passes with conditions and freezes any extension beyond Germany. Neither test fails outright, so in neither model does a row move; the finding sits in the conditions and the freezes, and a test that fails outright is what moves a mark up a row.
Author's note needed: a short passage, two or three paragraphs, from the author's own practice of a fallback that had quietly ceased to exist: a manual process everyone believed was still available until the day it was needed, discovered months rather than years after go-live. It belongs here and should end with what the organisation did about it.
New and retired
The third kind of change is the simplest to draw and the easiest to misread. A mark that was not there at the start carries a tick and the word "new". A mark retired during the period is drawn hollow, with a cross, where it last stood, so that the year shows what was stopped as well as what was started; paused units are drawn hollow without the cross.
Nordvik Region's year has two new marks and one retired (illustrative). The new marks are small and sit in the bottom row: NR-SOC, which enriches and summarises alerts for six security analysts, goes live on 1 February at Level 1 Assisted with a filled diamond, a T2 seat and a solid baseline; NR-EXP, which proposes an order for fixing exposures of the Region's internet-facing services, goes live on 1 April at Level 0 Advisory with a dashed baseline. Both arrive with their controls; the dashed line under a new mark is a fair question for the next quarter. The retired mark is NR-TL, the recruitment screening pilot, paused in September 2026 when the union for care staff asked how the ranking was made and the supplier could not show it. It stands hollow and crossed at Level 1 Assisted, R3 Hard to reverse, with a hollow diamond, a dashed baseline and a T3 seat: a high-risk use, in the AI Act's sense, that never had an enforced policy point or automatic evidence. The timeline entry for 30 June reads, in full, "Not resumed when the HR director reported to the regional executive committee."
The misreading to guard against is counting. Eleven marks at the start and thirteen at the end sounds like growth; two of the thirteen are small security tools at the two lowest levels, and the unit that left stood higher up. What the new and retired marks say is where the organisation added autonomy and where it took it away.
What the trails leave out
A year can change a landscape without moving a single mark. Hansa Mutual's V2 shows no trail, no tick and no cross, while its timeline holds four entries, every one a change of control. Nordvik Region has three such changes beside its trails (illustrative): on 30 June its ambient AI acquires a T2 seat, a hollow diamond and a dashed baseline when the supplier-enabled features are inventoried; on 1 September the embedded workplace assistant pilot grows from S to M and its diamond fills; and on 1 October the benefits-triage system adds supplier attestations after a stop drill is re-run within budget. A trail shows none of these, which is why the notation keeps the decision-rights and evidence views of Chapter 17 beside the time view: a year is read in V2 for movement, and in V4 and V5, at both dates, for control.
Saying what comes next
Every picture of a year invites a sentence about the next one, and the notation offers no symbol for it on purpose: a landscape is a picture of what is. What the book offers instead is the discipline of AI Governance, Chapter 22, which labels every statement about the future as one of three things: observable, for developments already visible in adopted legislation, published guidance, cited standards or production systems; expected, for developments with strong evidence but uncertain timing or form; and speculation, for developments that are plausible and consequential but not yet evidenced (2, Nordqvist, 2026). Observable trends justify commitment, expected ones preparation and speculative ones reversibility.
The honest way to teach the labels is to apply them to this chapter's own statements. That the AI Act's obligations for the high-risk uses listed in its Annex III, such as AI in recruitment or in the allocation of work, apply from 2 December 2027 is observable: it is in the adopted text of Regulation (EU) 2026/1744 (40, European Union, 2026). That the next Eurostat survey will report a higher share of enterprises using AI than 19.95 per cent is speculation. Two consecutive rises are a short run, the flat period from 2021 to 2023 is evidence against assuming a line, and the 2025 figure rests on a longer list of technologies than the 2024 one. That the share will keep rising at the 2024 to 2025 pace until most enterprises use AI is speculation of the same kind, and a weaker one. An expected statement needs more than a short run of figures: a decided instrument with a date, or a trend with a mechanism behind it. A reader who draws any line past the later dot of a trail owes it one of the three labels.
The labels apply to statements about the real world. The year of Nordvik Region and Hansa Mutual is a scenario, and what it says about 2027 is fiction, labelled neither observable nor expected. A sentence such as "agents will take over the decision of benefit cases" is a statement about the real world, and it is speculation: in the models, caseworkers decide every case at Nordvik Region and "settle a claim" stands at Level 0 Advisory at Hansa Mutual. The author's own projections belong to Chapter 20.
Reading a year
The practical guide is a routine, and it is short because the picture does the work. Render V2 every quarter, not every year: months are the unit in which fallbacks disappear, and a quarterly render gives four chances to catch a change nobody filed. Keep the same start date, so that each quarter's picture is the year so far and the fourth is the year. Then ask five questions of the trails, in this order.
- Which marks moved right, and what travelled with them? A trail to a higher level is a delegation. At its end the diamond should be filled, the seat present and the baseline solid; if any is missing, the controls stayed where the use started.
- Which marks should have moved up a row, and did not? For every mark at R1 or R2, ask when the organisation last did the work without the unit. If the answer is "not since go-live", the row is inherited rather than earned; schedule the test and move the mark if it fails.
- Which marks changed colour? A change of mode is a change event; ask whether the controls set for the old mode still fit.
- Which marks are new, and which were retired? A new mark without a seat is a unit nobody has decided about; one with a dashed baseline is a unit whose evidence is a promise. A retired mark is a decision too: ask what was stopped and why.
- What changed that no trail can show? Hold the later picture against the earlier one and read the seats, diamonds and baselines, or read V4 and V5 at both dates. Then read the timeline notes: every trail, tick, cross and changed seat should have one.
The worked example is the model itself. The two trails in Figure 15.1 are produced by the timeline entries of the rostering unit and the agentic work tools, and Chapter 14 prints the rostering entries. Each entry names a date, the fields that changed and a note that says why; the renderer applies them up to each of the two dates and draws the difference. That is the standard to hold a model to: no trail without an entry, no entry without a note, and no note that does not name the decision behind it.
For an executive and a public official
Ask for the quarterly V2 and the answers to the five questions on one page. Ask in particular for the date of the last test in which the organisation did a delegated task without the system, and for what it found. Trails show movement; the seats, baselines and tests are where accountability sits.
Nordvik Region and Hansa Mutual
Both organisations are illustrative; everything here is read from the two models and is not evidence about any real organisation. Chapter 18 tells the year in full; this chapter uses each organisation for one kind of change.
Nordvik Region's year is the year of trails: one unit allowed to do more, with its controls in place seven weeks earlier, and one allowed to do less.
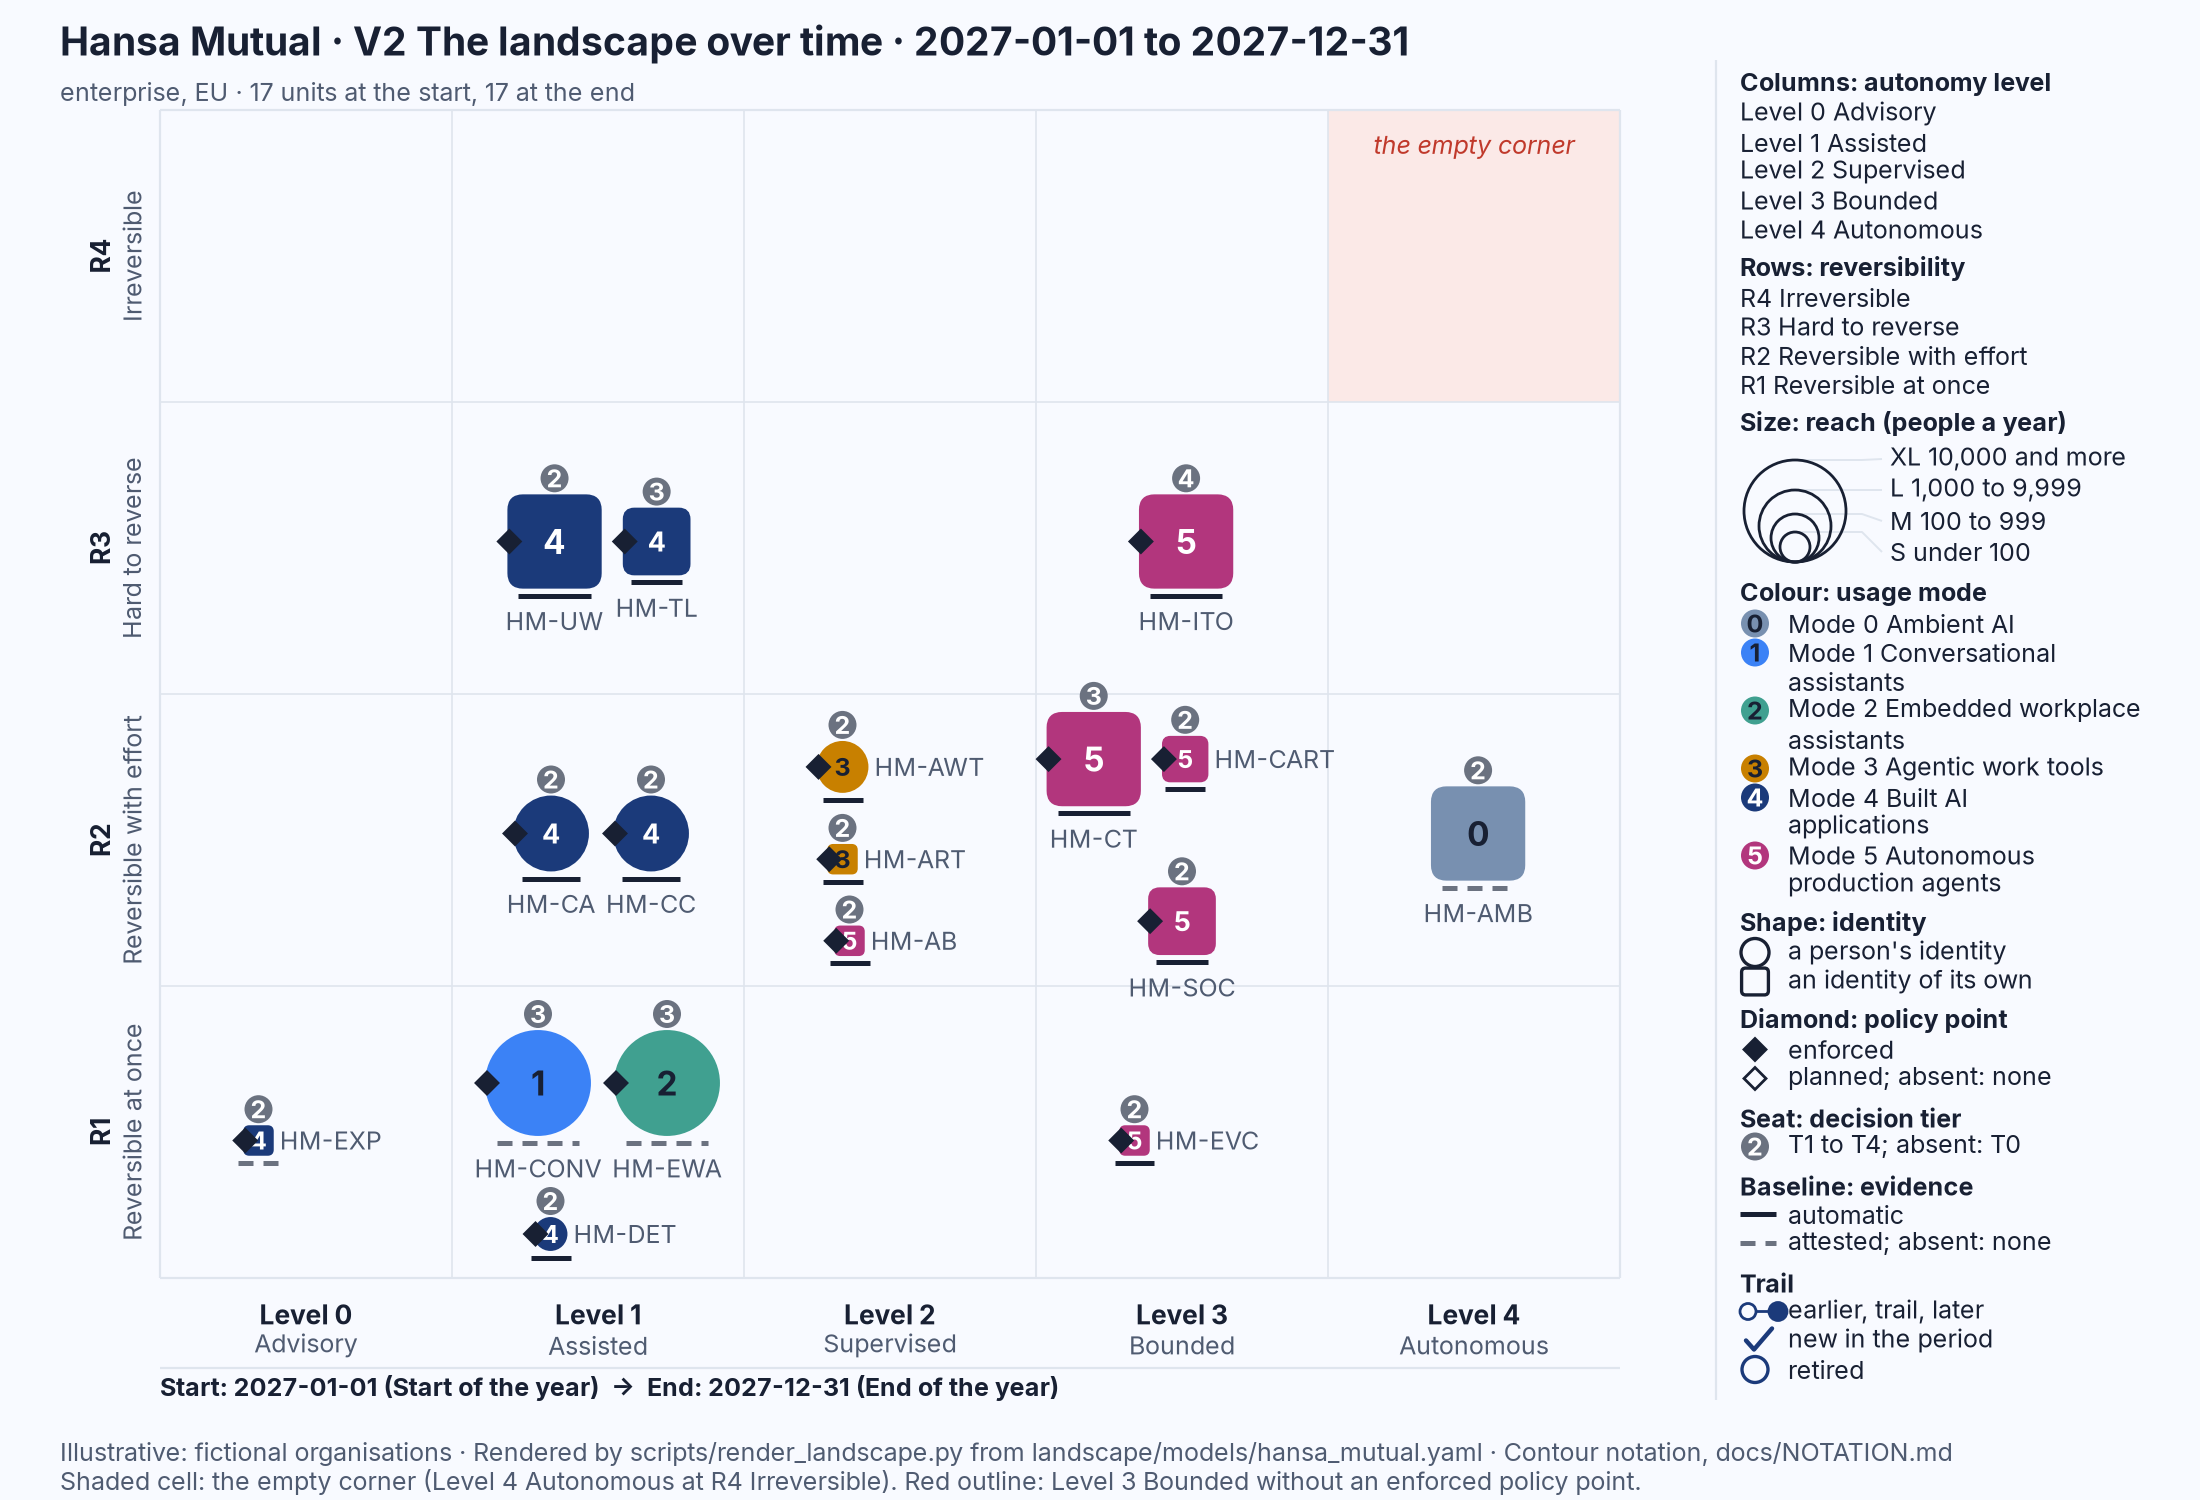
Figure 15.3: Hansa Mutual's landscape over the year 2027, V2: no mark changed column or row, and the year's four changes are in the seats and baselines. Illustrative: rendered from landscape/models/hansa_mutual.yaml.
Hansa Mutual's year is the year of seats (Figure 15.3). It has seventeen marks on both dates, six of them Mode 5 Autonomous production agents: five at Level 3 Bounded, each with a filled diamond, a seat and a solid baseline, and the agent-boss pilot at Level 2 Supervised. The first stop drill of the IT-operations agent takes 17 minutes against a budget of 5, because the alert reaches a duty analyst who does not hold the decision and the 15-minute tokens outlive the revocation (The Transformed Security Architect, Chapters 10 and 25) (6, Nordqvist, 2026); on 31 March the board takes the decision right over every agent with write access to production, and that seat rises from T2 to T4. On 30 April the claims-triage agent's allocation of work to handlers is reassessed under Annex III point 4(b), the entry for AI that allocates work or monitors people at work, and its seat rises from T2 to T3 under the group's policy on AI in management; the same day the recruitment-screening supplier's logs are retained and its baseline turns solid. On 30 September the group's ambient AI enters the AI inventory with a named owner: a T2 seat where there was none, and a dashed baseline. A reader who looked for trails alone would miss all of it. Neither picture ranks the other.
Summary
The time frame of the notation draws change as a trail: a hollow outline where a mark was, a thin line in its colour, the filled mark where it is, two dates in a strip under the view, a tick for a mark new in the period and a cross for one retired. A trail is drawn for a change of column or row and for nothing else; a change of colour, size, seat, diamond or baseline is read against the earlier picture or in the decision-rights and evidence views.
Measured change is uneven and its lines are only as honest as their ends. The share of EU enterprises using at least one AI technology rose from 7.65 per cent in 2021 to 8.06 in 2023, then to 13.48 in 2024 and 19.95 in 2025; between 2024 and 2025, 26 of 27 Member States rose, by amounts from under a point to more than fourteen, and the 2025 question listed one more technology than the 2024 one (9, Eurostat, 2026). A trail with no note behind it is the first thing to ask about.
Three movements matter. Drift between modes shows as a trail to the right whose end lacks a filled diamond, a seat or a solid baseline (2, Nordqvist, 2026). Decay of reversibility, which AI Boss illustrates and does not measure, shows as a mark whose row should have moved up and did not, and is caught only by doing the work without the unit for a defined period (7, Nordqvist, 2026). New and retired marks show where autonomy was added and where it was taken away.
Anything said about the year to come about the real world carries one of three labels, observable, expected or speculation; the scenario of the two organisations carries none. The routine is a quarterly re-render and five questions of the trails: what moved right and what travelled with it, what should have moved up and did not, what changed colour, what is new and what was retired, and what changed that no trail can show. Chapter 16 places the same marks in their suppliers and jurisdictions, and Chapter 17 reads the seats and baselines this chapter could only point to.
Sources
- Eurostat (2026). Artificial intelligence by size class of enterprise. Online data code isoc_eb_ai, last updated at the source 15 June 2026; retrieved 7 November 2026 through the Eurostat dissemination API (JSON-stat 2.0) as the datasets data/eurostat_isoc_eb_ai (AI use by technology type) and data/eurostat_isoc_eb_ai_purpose (AI use by purpose). DOI: https://doi.org/10.2908/ISOC_EB_AI. (9, Eurostat, 2026)
- Nordqvist, G. (2026). AI Governance: Governing Artificial Intelligence in European Enterprises and Public Authorities. The Transformed Architecture, Book 2, published at aig.geon.se. (2, Nordqvist, 2026)
- Nordqvist, G. (2026). AI Boss: When Artificial Intelligence Manages People in European Enterprises and Public Authorities. The Transformed Architecture, Book 7, published at aiboss.geon.se. (7, Nordqvist, 2026)
- Nordqvist, G. (2026). AI Threat: Are the Dystopias Coming True? Evidence, Risk and Response for European Enterprises and Public Authorities. The Transformed Architecture, Book 5, published at aithreat.geon.se. (5, Nordqvist, 2026)
- European Parliament and Council of the European Union (2026). Regulation (EU) 2026/1744 of 8 July 2026 amending Regulations (EU) 2024/1689, (EU) 2018/1139 and (EU) 2023/1230 as regards the simplification of the implementation of harmonised rules on artificial intelligence (Digital Omnibus on AI). Official Journal of the European Union, L series, 2026/1744, 24 July 2026; in force from 27 July 2026, the third day after publication. (40, European Union, 2026)
- Nordqvist, G. (2026). The Transformed Security Architect: Role, Craft and Career in the Age of AI in European Enterprises and Public Authorities. The Transformed Architecture, Book 6, published at tsa.geon.se. (6, Nordqvist, 2026)