Appendix B: Drawing the Views by Hand, and the Rules on One Page
The notation of this book, Contour, was designed so that a person with a pen can draw it before anyone opens a file. The renderer, scripts/render_landscape.py, makes the sketch exact, not possible: it places every mark from a committed model, keeps the sizes and colours identical from one picture to the next and refuses to draw what the specification does not define. The sketch comes first, in the meeting where the question is asked, and most first landscapes are drawn that way. This appendix gives one page per view, V1 to V6, each as a numbered pen-and-paper procedure, each followed by the renderer's exact version of the same view so that you can check your sketch against it, and each ending with the three mistakes people make when they draw it. The last page carries the nine rules of thumb of Part II on one page, with nothing else, so that it can be torn out.
You need four things: a pen, one sheet of paper, landscape orientation, five minutes, and the organisation's list of AI uses. The list is the inventory that Chapter 14 describes, or, failing that, whatever the room can name in the first two minutes; a landscape drawn from an incomplete list is still a landscape, and the gaps are its first finding. For each use you need, or will have to guess and mark as a guess, the seven dimensions: the autonomy level, the reversibility tier, the reach, the usage mode, the identity, whether a policy point exists and who holds the decision right, and where the evidence comes from. The tables that define the scales are in Appendix A and are not repeated here; keep the reference card beside you. One pen is enough. The mode's digit, written inside every mark, carries what the colour carries in the rendered view, and the notation never depends on colour alone. If you have six coloured pens, use the mode colours that Appendix A names; if you have one, the picture loses nothing the notation requires.
Three conventions hold on every page. Write the organisation's name and the date in the top-left corner, because a landscape is always drawn at one date. Write the unit's id beside a small mark and beneath a large one, as the renderer does, so that the ids do not collide. And draw what you do not know as absent rather than leaving the unit off the page: a mark without a seat says that nobody has been named, which is a finding; a unit left off the page says nothing.
Page 1: the one-page landscape (V1)
V1 The one-page landscape puts every unit on the grid of autonomy by reversibility, with all seven dimensions on each mark. The cells below assume a sheet in landscape orientation with cells about 40 mm square, which leaves room for the legend strip at the right; any size works as long as the four mark sizes keep their ratio.
- Draw a grid of five columns and four rows. Label the columns, from left to right, Level 0 Advisory, Level 1 Assisted, Level 2 Supervised, Level 3 Bounded and Level 4 Autonomous, with the level in bold and the name beneath it. Label the rows, from the top down, R4 Irreversible, R3 Hard to reverse, R2 Reversible with effort and R1 Reversible at once, written sideways at the left edge. R4 is at the top because the hardest thing to undo should be the first thing the eye meets.
- Shade the top-right cell lightly, Level 4 Autonomous at R4 Irreversible, and write "the empty corner" in it. In a well-governed landscape nothing is ever drawn there, and the shading is there so that anything drawn there is seen at once.
- Take the first unit on your list and find its cell: the column is the highest level it holds for any action that changes something outside the unit, the row is its reversibility tier. Reading, enriching and researching do not set the column; page 4 shows them. Place one mark in that cell: a circle if the unit acts with a person's identity and permissions, a rounded square if it acts with an identity of its own.
- Draw the mark in one of four sizes by its reach, the number of people its actions touch in a year, never the number of transactions: S under 100 people, M 100 to 999, L 1,000 to 9,999, XL 10,000 and more. With 40 mm cells, draw the diameters at about 5, 8, 12 and 17 mm, which is the renderer's ratio of 1 : 1.6 : 2.4 : 3.4. Pick the four sizes before you draw the first mark and keep to them.
- Write the usage mode's digit inside the mark, 0 to 5, in bold, large enough to read from across the table. Colour the mark in the mode's colour if you have the pen.
- Add the diamond at the left edge of the mark, centred on the edge: filled if a policy decision point outside the model enforces what the unit may do, hollow if one is planned, no diamond if there is none. If the mark sits at Level 3 Bounded and its diamond is not filled, draw a second, thin outline around the mark; the renderer draws that outline in red, because a Level 3 capability without a policy point is Level 4 with a misleading label.
- Add the seat above the mark: a small grey circle, a little above the top edge, with the decision tier's digit inside it, 1 to 4, for the operator or user, the system owner or architect, an executive, or the board or elected body. If nobody is named, draw no seat.
- Add the baseline beneath the mark: a short line about as wide as the mark, a little below its bottom edge, solid where the system itself produces the evidence that the controls hold, dashed where a person or a supplier declares it, no line where there is none.
- Write the unit's id beside the mark for an S or an M, beneath the baseline for an L or an XL. If the unit is paused, draw it hollow; if it has been retired, draw it hollow with a cross through it.
- Repeat from step 3 for every unit. Several marks share a cell; spread them inside it and let the ids keep them apart.
- Draw the legend strip down the right-hand margin, in the order Appendix A gives: the five columns named, the four rows named, the four sizes nested, the six modes with their digits, the two shapes, the diamond filled and hollow, the seat with "T1 to T4", the baseline solid and dashed. Then read the page in the thirty-second order of Appendix A, the empty corner first and the names last.
The rendered version of the same view is Figure 23.1. Check your sketch against it: eleven marks, one of them a bare grey-blue square at Level 4 Autonomous with no diamond, no seat and no baseline; two XL marks, at Level 0 and at Level 4; three hollow diamonds; four dashed baselines; nothing in the empty corner.
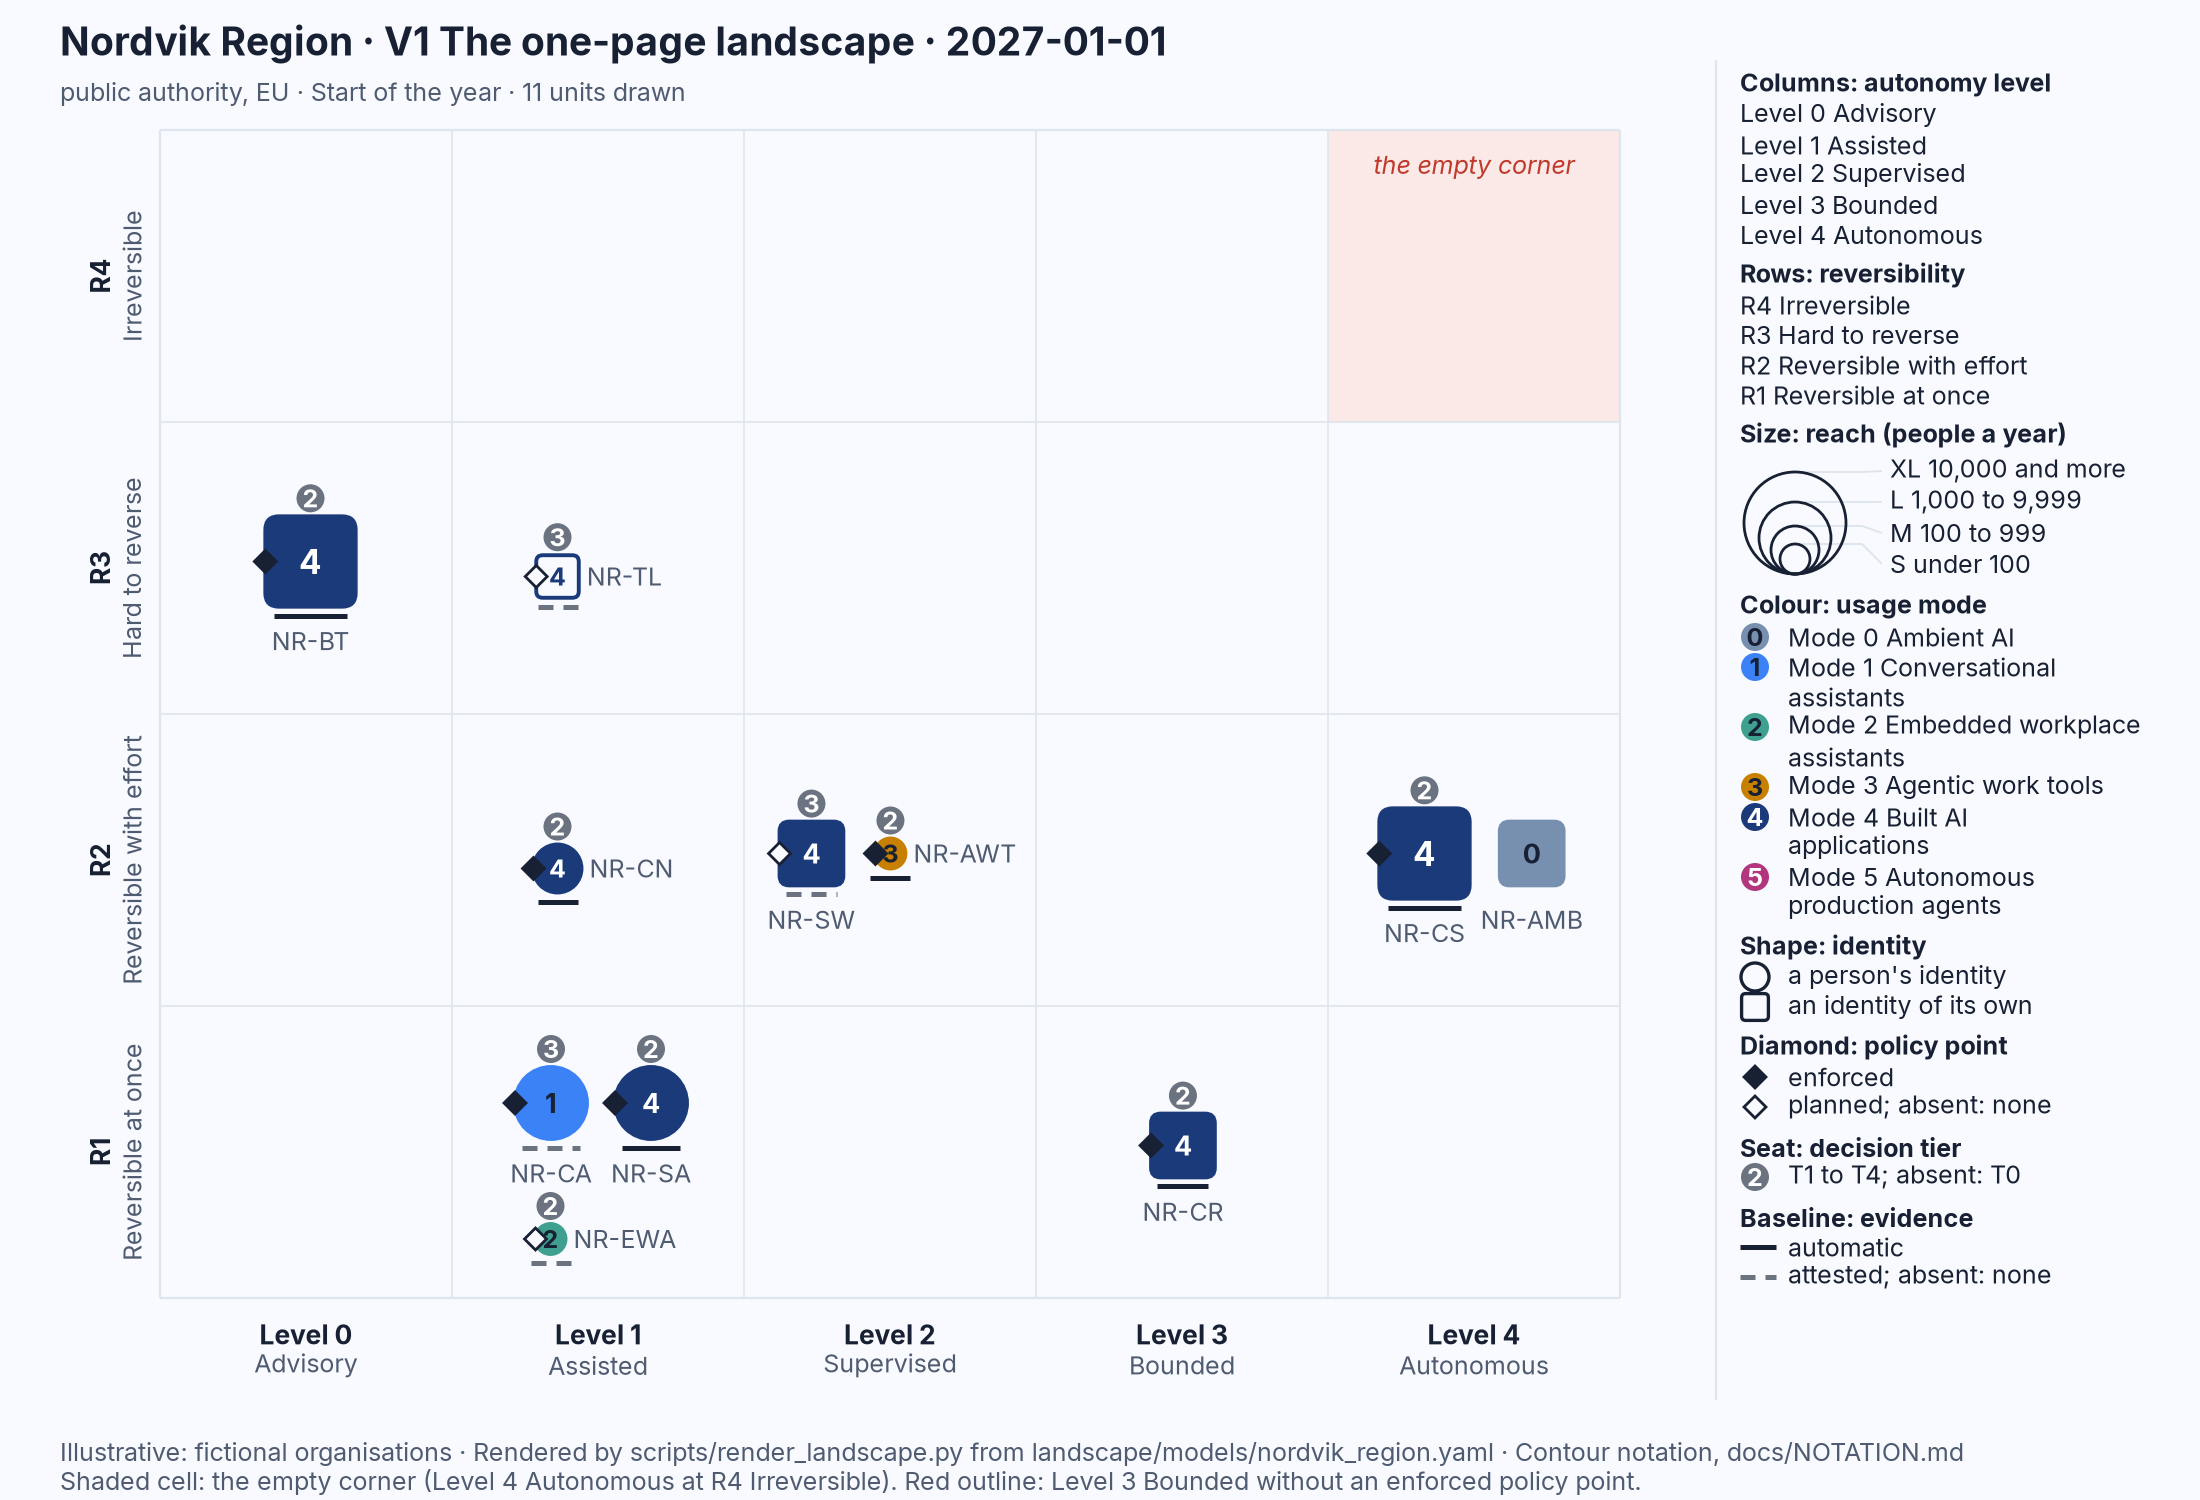
Figure 23.1: The renderer's V1 for Nordvik Region on 1 January 2027: the grid, the shaded empty corner, eleven marks with their diamonds, seats, baselines and ids, and the legend strip. Illustrative: rendered from landscape/models/nordvik_region.yaml.
Three mistakes people make when they sketch V1:
- One mark per product or per vendor. The unit is a use, not a system and not a supplier. An assistant that drafts letters and also files them is two marks, one at Level 1 Assisted and one at a higher level; the same model bought twice for two purposes is two marks. Drawing "the chatbot" as one mark hides the action that matters, which is almost always the one at the higher level.
- Placing the mark where the unit usually works instead of at its ceiling. A unit that drafts for most of what it does and executes one class of action without approval sits in the Level 3 column, not in Level 1. The decision-rights view on page 4 shows the whole span; the landscape shows the ceiling, and the ceiling is the fact a board needs.
- Flattering the size, or leaving out what is unknown. Reach is counted in people, not in transactions, and a guess is written as a guess; a mark drawn M because XL looked alarming is a false picture. Likewise a unit whose owner nobody can name is drawn without a seat, not left off the page. The absence on the page is the finding; the absence from the page is an omission.
Page 2: the landscape over time (V2)
V2 The landscape over time is V1 drawn at the later of two dates, with a trail for every mark that changed cell between them. It is read as one picture of a year, with the chapter saying what happened in between.
- Draw page 1 for the later date, with every unit that exists on that date drawn in full, as in steps 1 to 10 above. Leave room under the grid for one line of text.
- For every unit that was in a different cell at the earlier date, draw a hollow outline of the mark at its earlier position: the same shape and the same size, drawn in the mode's colour, with no digit, no diamond, no seat, no baseline and no id. Then draw a thin line, in the mode's colour, from the hollow outline to the filled mark. Only a change of column or row earns a trail; a seat acquired, a diamond filled or a baseline turned solid shows in the later mark alone.
- For every unit that appeared during the period, draw a small tick and the word "new" after its id. It has no earlier position and no trail.
- For every unit retired during the period, draw its mark at its last position hollow, with a cross through it, keeping its diamond, seat and baseline as they were; the retired mark is still counted among the units drawn. A unit paused at the later date is drawn hollow without a cross.
- Under the grid, write one line with the two dates: "Start: 2027-01-01 (Start of the year), End: 2027-12-31 (End of the year)". Never draw more than two dates in one view; a year is its start and its end.
- Add three items at the foot of the legend: the trail as a hollow outline, a line and a filled mark, labelled "earlier, trail, later"; the tick labelled "new in the period"; the crossed hollow mark labelled "retired".
- Under the title, write the counts the renderer writes: the units at the start and at the end, and the ids that are new, moved and retired.
Figure 23.2 shows the renderer's version of Nordvik Region's year. Check your sketch against it: two trails leave the Level 2 Supervised cell in opposite directions, one amber mark moving left to Level 1 Assisted and one navy mark moving right to Level 3 Bounded, so that the Level 2 column is empty at the end of the year; two marks carry the "new" tick; one mark at Level 1 and R3 is hollow with a cross; and the bare grey-blue square at the right edge has gained a hollow diamond, a seat and a dashed baseline without moving, which is why it has no trail.
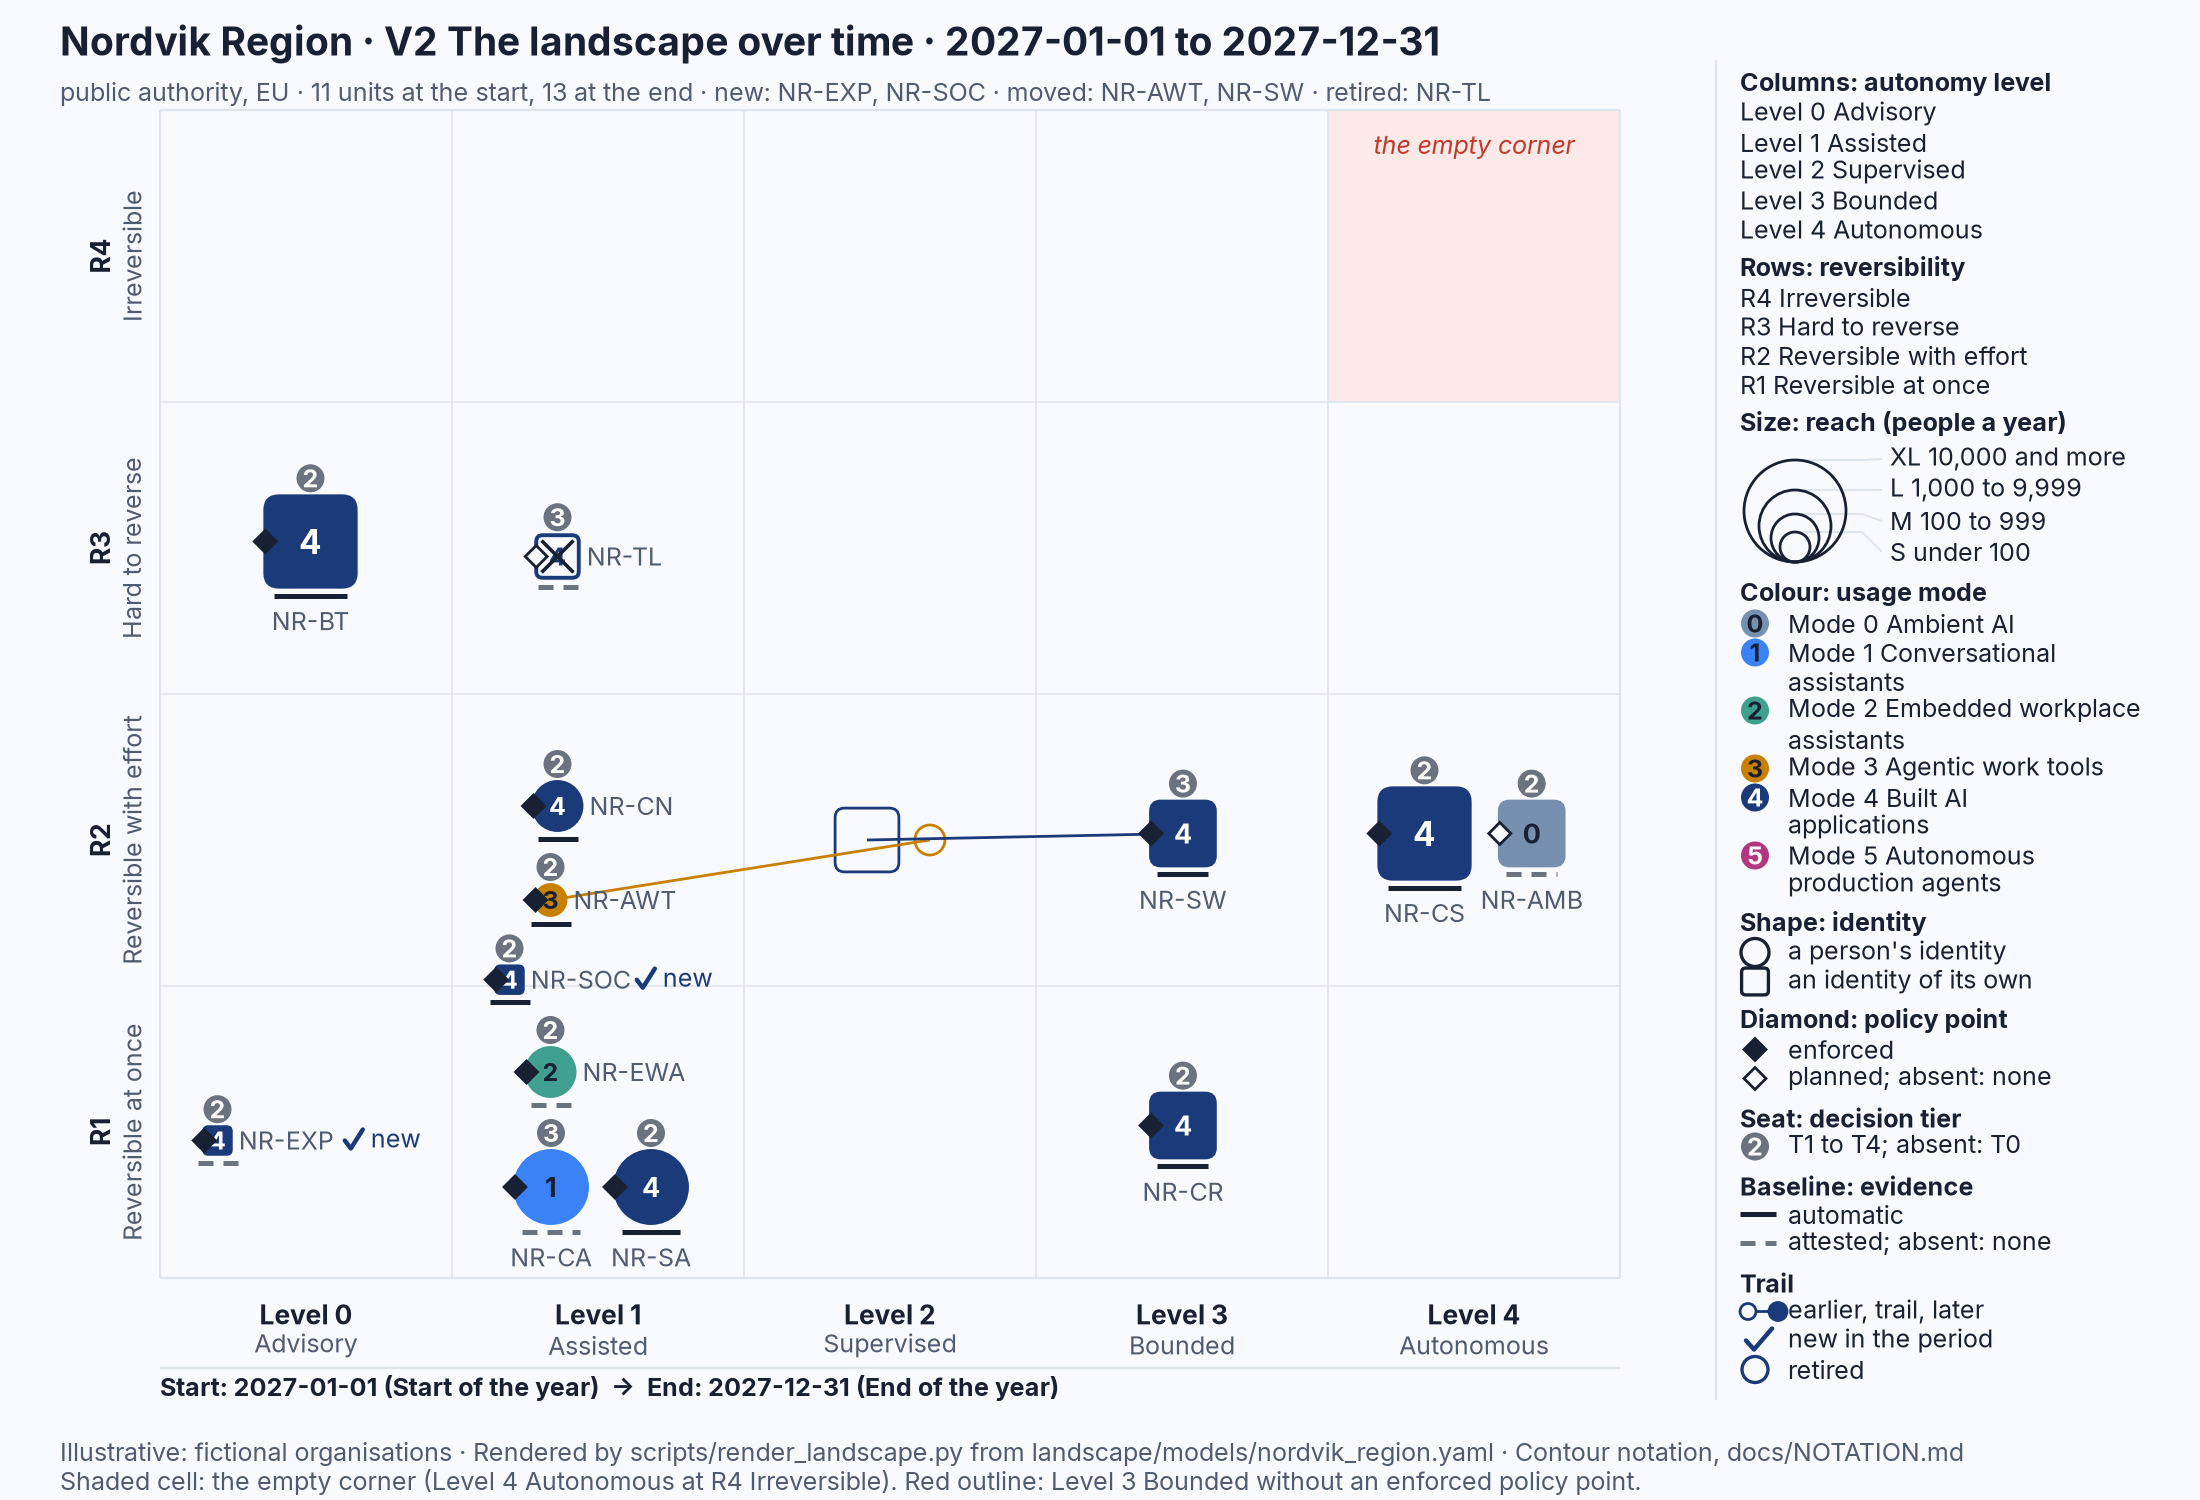
Figure 23.2: The renderer's V2 for Nordvik Region from 1 January to 31 December 2027: trails from the hollow earlier positions to the filled later marks, the new and retired marks, and the date strip. Illustrative: rendered from landscape/models/nordvik_region.yaml.
Three mistakes people make when they sketch V2:
- A trail for every change. Only a change of cell earns a trail. If every filled diamond and every new seat were drawn as a movement, the page would be a web of lines that said nothing about autonomy or reversibility; the later mark carries those changes on its own.
- Both ends filled, or a third date added. The earlier position is a hollow outline and nothing more, so that the eye knows which end is now. A mark drawn filled at both ends reads as two units, and a midpoint added "for the quarter" turns one picture into none. If the quarter matters, draw a second V2.
- Dropping the retired and forgetting the new. A year in which three pilots were stopped looks like a year of growth if the stopped marks are erased. The crossed mark and the "new" tick are what let the reader count what was started against what was ended, and both are part of the picture.
Page 3: the supply and sovereignty view (V3)
V3 The supply and sovereignty view takes the same marks off the grid and places them in containers: who hosts, operates or supplies each unit, by role and never by brand, and under which jurisdiction.
- Draw a large area at the left of the sheet and label it "EU and EEA". Inside it, draw a rounded rectangle with a solid border for the organisation's own boundary, labelled with the organisation's name and "own premises, tenant and data centre".
- Decide, for each unit, which container it sits in: the container of the supplier that hosts it; failing that, the supplier that provides its application; failing that, the one that operates it; failing that, the model provider. A unit hosted on the organisation's own premises sits inside the solid boundary, whatever other suppliers it has.
- For each supplier that holds at least one unit, draw a rounded rectangle with a dashed border, labelled by role and jurisdiction, "Supplier: hosting (EEA)", "Supplier: application (non-EU)", "Supplier: model provider (non-EU)", with a generic description of the supplier beneath, never a brand. Draw no container for a supplier that holds nothing. A supplier inside the EU or the EEA sits inside the EU and EEA area beside the solid boundary; a supplier outside it sits to the right of the area.
- Around each group of suppliers outside the EU and the EEA, draw a rounded rectangle with a dotted border, labelled "Non-EU jurisdiction:" and the place, "outside the EU", "EU region of a non-EU vendor", "various". Containers nest: the dashed supplier box sits inside the dotted jurisdiction box.
- Draw each unit's mark in full in its container, as on page 1, with its diamond, seat, baseline and id. The shape, the size and the digit do not change between views.
- Where a unit takes its model from a supplier other than the one whose container it sits in, draw a small rounded chip labelled "model" inside that model provider's dashed box, and a thin line from the mark to the chip. One chip serves every unit that draws on the same provider. A unit whose only supplier is a model provider sits in that provider's box and needs no chip.
- Add to the legend the three container borders, solid for the own boundary, dashed for a supplier by role, dotted for a non-EU jurisdiction, and the chip for a model from a supplier.
Figure 23.3 is the renderer's version for Hansa Mutual. Check your sketch against it: thirteen marks inside the solid boundary, because the group hosts them in its own data centre; two of those thirteen, a navy circle and an amber circle, have thin lines running out of the EU and EEA area to a single "model" chip in a non-EU model provider's box; four marks sit outside the area, in three dotted jurisdiction boxes, among them the bare grey-blue square with no diamond, no seat and no baseline, inside a box labelled "various".
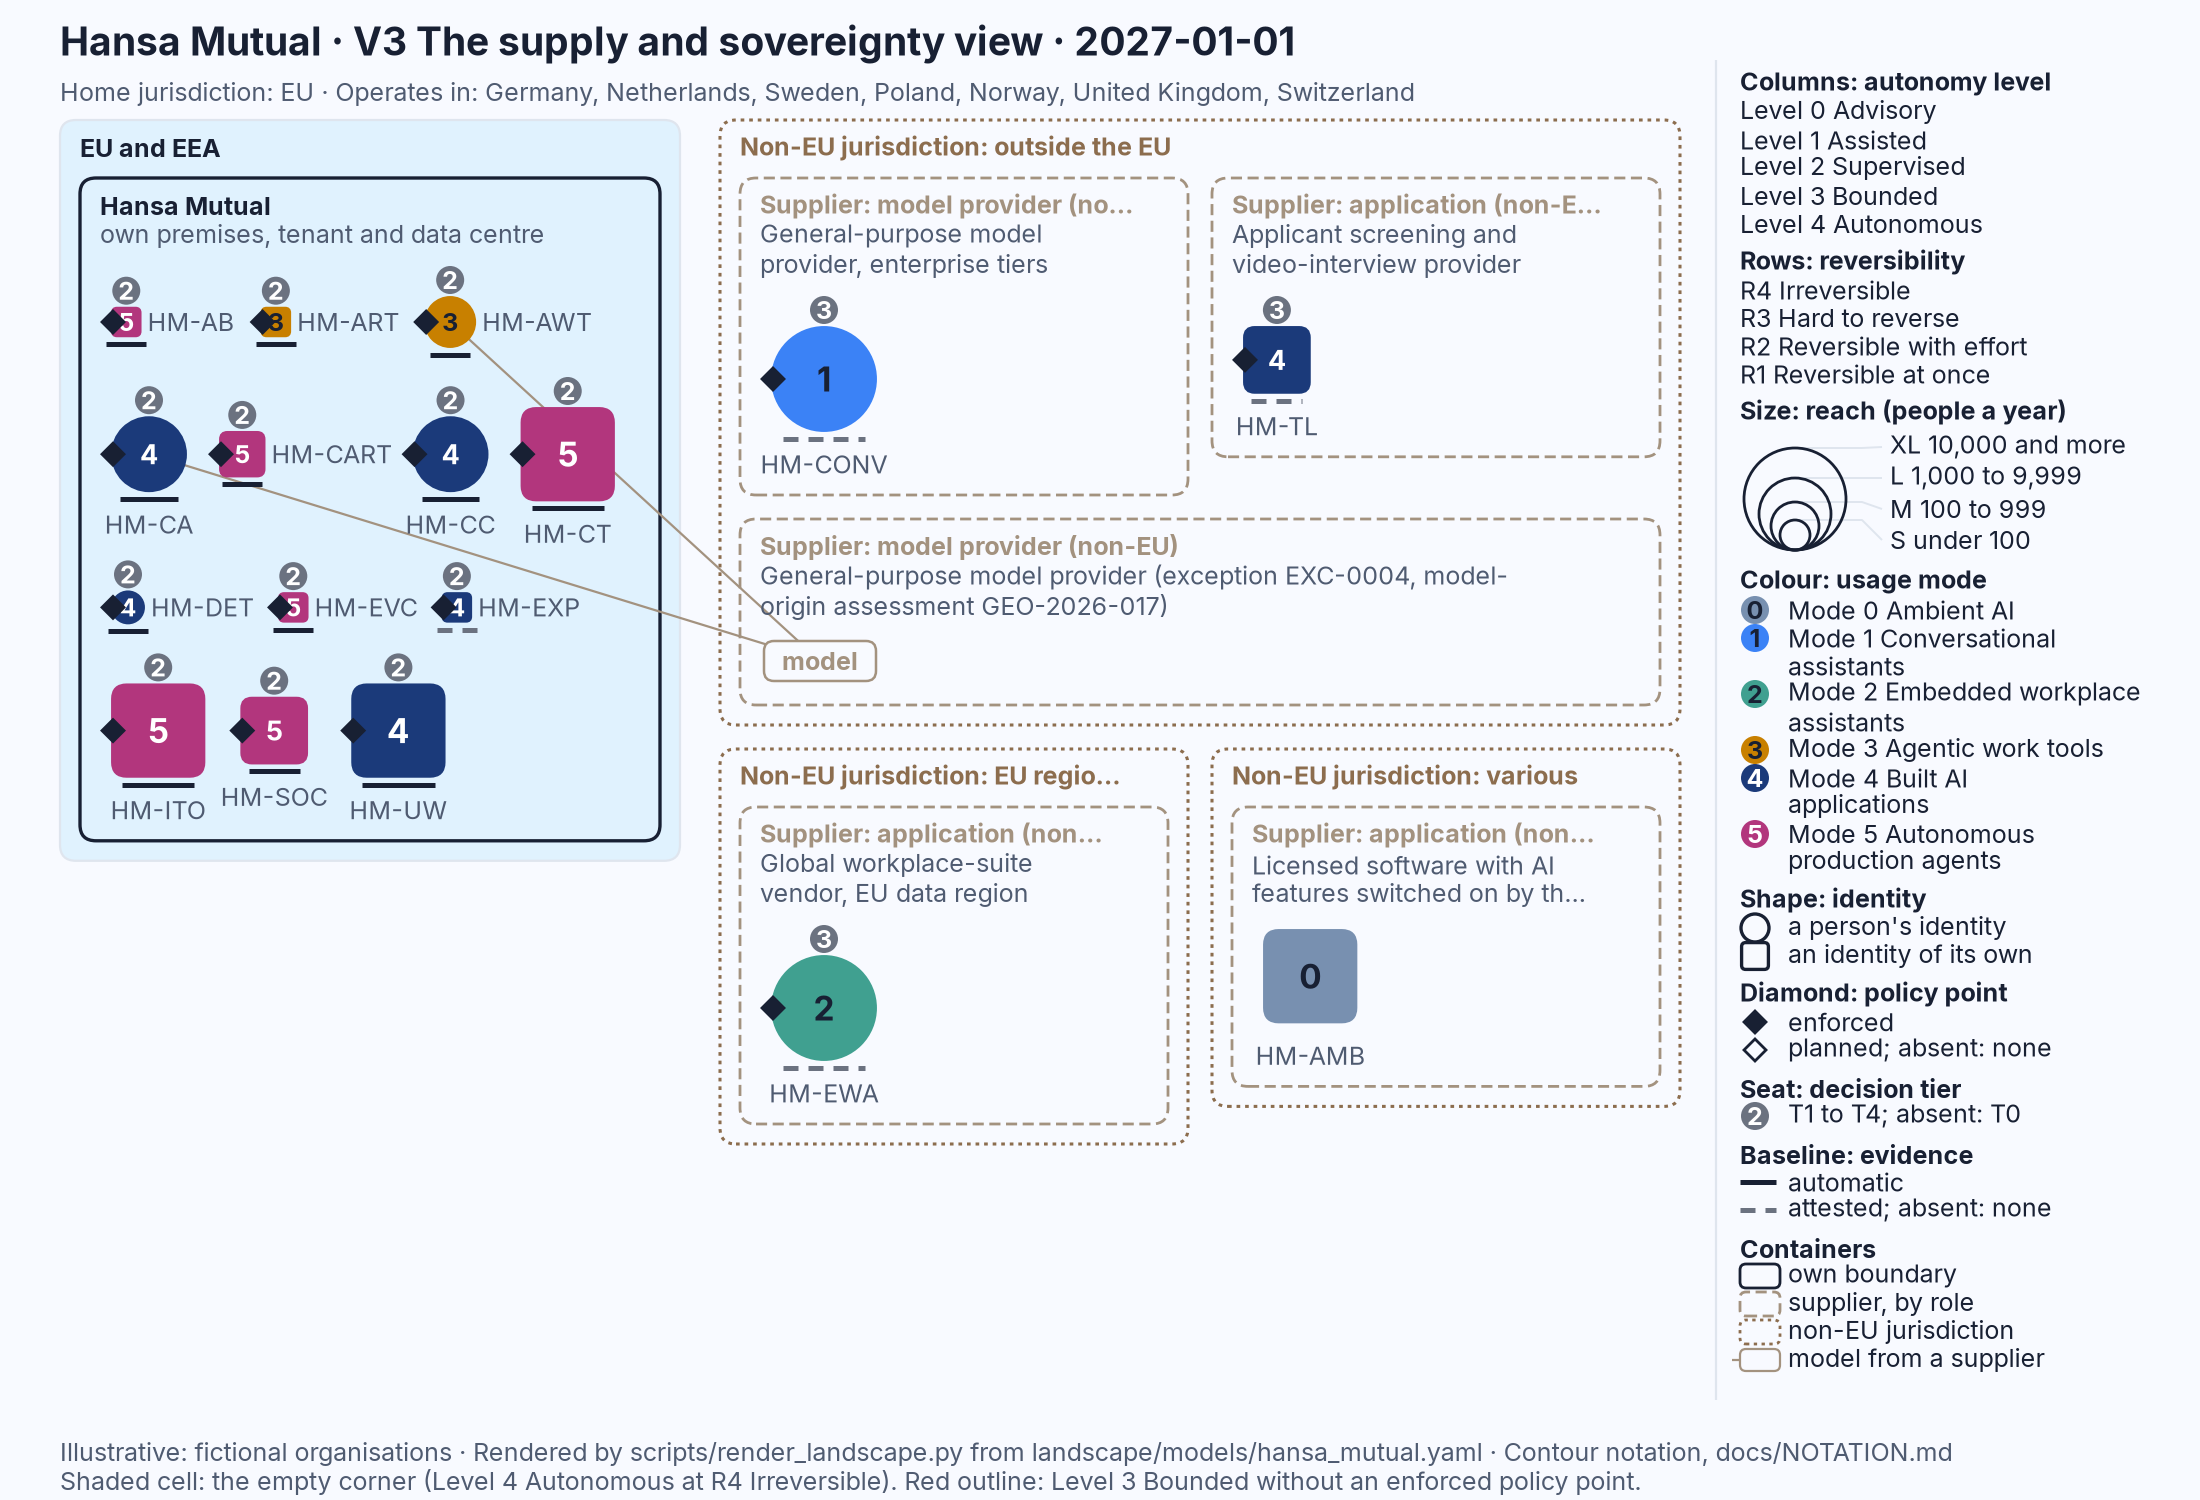
Figure 23.3: The renderer's V3 for Hansa Mutual on 1 January 2027: the solid own boundary, the dashed supplier containers labelled by role, the dotted non-EU jurisdictions and the model chip. Illustrative: rendered from landscape/models/hansa_mutual.yaml.
Three mistakes people make when they sketch V3:
- Labelling the containers by brand. The view asks what a supplier does for the unit and where it stands in law, and a brand answers neither. "Supplier: hosting (EEA)" survives a change of vendor; a logo does not, and a logo invites the model instinct of Chapter 7 back into the room.
- Placing the mark where the model comes from. A unit hosted on the organisation's premises that calls a model abroad sits inside the solid boundary, with a line to the chip. Moving the mark into the model provider's box would say that the provider hosts and operates the unit, which is a different and larger claim; the chip exists so that the smaller, true claim can be drawn.
- Nesting by geography instead of by jurisdiction, and drawing empty boxes. A non-EU vendor's EU data region is a non-EU jurisdiction with the words "EU region" in its label, not a box inside the EU and EEA area; the processing is in Europe and the vendor is not. And a container drawn for every supplier in the contract register, whether or not any unit sits in it, turns the picture into an org chart of procurement. Draw a container only where a mark or a chip goes.
Page 4: the decision-rights view (V4)
V4 The decision-rights view gives each unit a row and shows, as a bar, how far its autonomy reaches, with the seat at the ceiling, so that the reader can see whether the person who decides sits where the action happens.
- Rule the sheet into rows, one per unit, with a wide label area at the left and five equal columns to the right headed Level 0 Advisory to Level 4 Autonomous. Order the rows by level, highest first, and by id within a level.
- In the label area of each row write, from the left, a small mark of fixed size with the mode's digit, circle or square by identity; the id in bold; the reversibility tier and the reach, "R2 XL"; and the unit's name.
- For every row whose tier is R3 Hard to reverse or R4 Irreversible, shade the Level 4 Autonomous column lightly across the row. This is the empty-corner rule extended to the hard-to-reverse row: nothing in those rows should reach the last column.
- Draw the unit's bar from the left edge of Level 0 to the right edge of its ceiling, the highest level it holds for any action that changes something outside the unit. Shade the bar darker from column to column, pale at Level 0 and dark at Level 4, so that a long bar is visibly heavier than a short one. Outline the bar thinly; if the ceiling is Level 3 Bounded and the policy point is not enforced, outline it in red.
- At the right end of the bar, draw the diamond: filled where the policy point is enforced, hollow where it is planned, none where there is none. Immediately to the right of the diamond, draw the seat, the small grey circle with the tier's digit. The seat sits at the ceiling, not beside the name, because the question is who decides at the level the unit actually reaches.
- Where the unit holds several levels, one per class of action, draw a thin bar under the main bar for each class, with the action's name in the label area, from Level 0 to that action's level. A thin bar for an action that changes something outside the unit that runs past the main bar's ceiling is an error in your list, because the ceiling is the highest of them; a thin bar for a read-only action, such as reading telemetry, may run past it.
- Draw the legend strip as on page 1.
Figure 23.4 shows the renderer's version for Hansa Mutual. Check your sketch against it: seventeen rows; the first row runs to Level 4 Autonomous and ends with no diamond and no seat; five rows end at Level 3 Bounded, every one with a filled diamond and a seat marked 2; six rows carry thin bars, and in two of them one thin bar, "read telemetry" and "enrich an alert", runs the whole width to Level 4 while the row's other actions stop well short of it; three rows, each at R3, have the last column shaded.
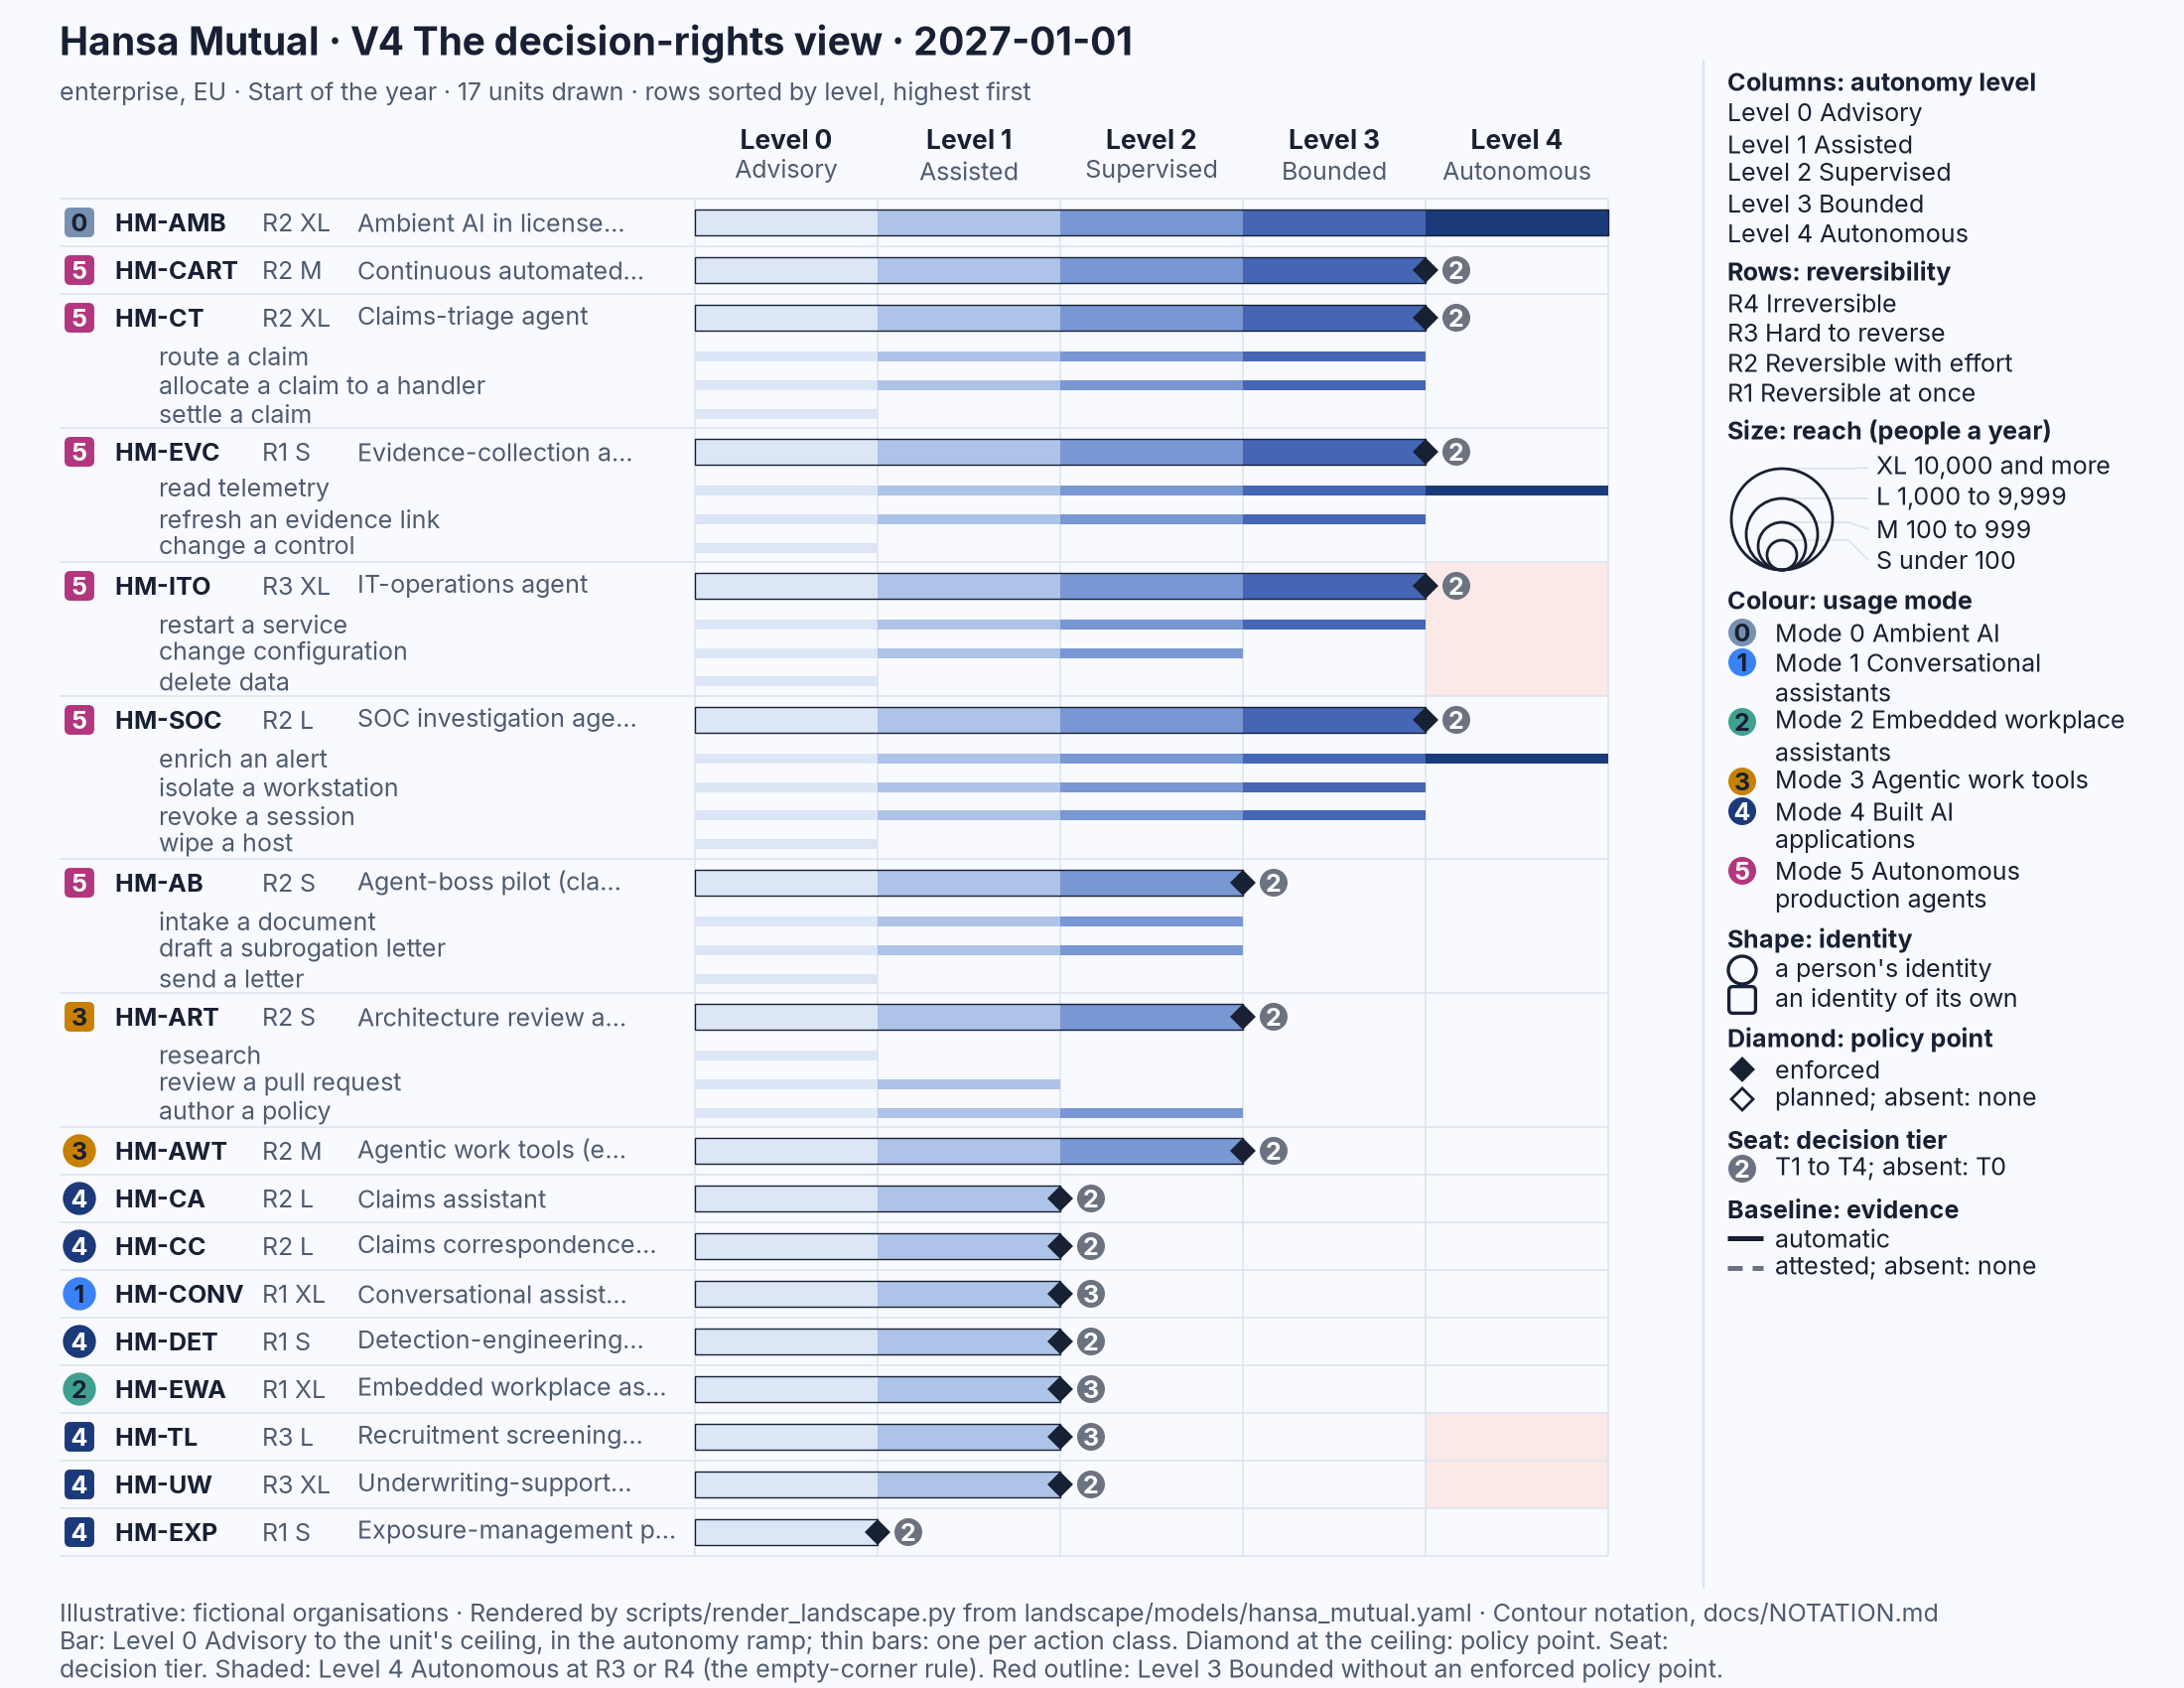
Figure 23.4: The renderer's V4 for Hansa Mutual on 1 January 2027: one row per unit, the bar in the autonomy ramp to each unit's ceiling, thin bars per action class, the diamond and the seat at the ceiling and the shaded Level 4 column on the hard-to-reverse rows. Illustrative: rendered from landscape/models/hansa_mutual.yaml.
Three mistakes people make when they sketch V4:
- Drawing the bar to the typical action and skipping the thin bars. A bar that stops where the unit spends most of its time understates it; a bar to the ceiling without the thin bars overstates every action. The pair is the point of the view: the ceiling says what the unit may do, the thin bars say for which actions, and the gap between a short "settle a claim" bar and a long "route a claim" bar is exactly the design the mandate recorded.
- Putting the seat by the name. Drawn in the label area, the seat says that someone owns the unit. Drawn at the ceiling, it says that someone decided that the unit may act at that level, which is the claim the view tests. A seat marked 2 at the end of a Level 3 bar is a system owner who took a decision the organisation may think belongs to an executive; moved to the left, that question disappears.
- Sorting by name and forgetting the shading. Rows in alphabetical order scatter the Level 3 and Level 4 units through the page, and the first thing the view should show, the agents at the top with their diamonds and seats, has to be hunted for. The shading of the last column on the R3 and R4 rows is what makes a bar that reaches into it a visible breach rather than a long bar.
Page 5: the evidence view (V5)
V5 The evidence view gives each unit a row and asks where the proof that its controls hold comes from, kind by kind.
- Rule the sheet into rows, one per unit, in the same order as page 4, with the same label area at the left: the small fixed-size mark with the mode's digit, the id, the tier and reach, and the name. Under the small mark draw the unit's baseline, solid or dashed or absent, as on page 1, so that the summary and the detail sit side by side.
- Head five columns to the right: "Logs", "Tests and evaluations", "Gates and policies as code", "Attestations" and "None".
- For each unit, fill the cell solid in each of the first three columns where that kind of evidence is produced by the system for this unit: logs that are retained, tests and evaluations that are run, gates and policies as code that are enforced. These are automatic evidence and are always drawn filled, whatever the unit's summary field says.
- Hatch the "Attestations" cell with diagonal lines where the evidence for the unit is a declaration by a person or a supplier: a questionnaire answer, a contract clause, a policy document, a signed attestation. Attested evidence is always hatched, never filled.
- Where the unit has no evidence of any kind, draw a thin outline around the "None" cell and write "none" in it. Leave no row blank: an empty row looks like a row you forgot, and "none" is a finding.
- Read down the "Attestations" column against the tier and reach written in each label: a hatched cell on an R3 row is a control whose proof is a promise, and that is the row to ask about first.
- Draw the legend strip as on page 1.
Figure 23.5 shows the renderer's version for Nordvik Region. Check your sketch against it: eleven rows; the first row, the bare grey-blue mark, has nothing in four columns and "none" in a red outline in the fifth; four rows have the "Attestations" cell hatched and nothing else; one of those four is on an R3 row; three rows have all three of the first cells filled, and three more have two of them; the baseline under each small mark on the left agrees with the row, solid where cells are filled, dashed where the only cell is hatched.
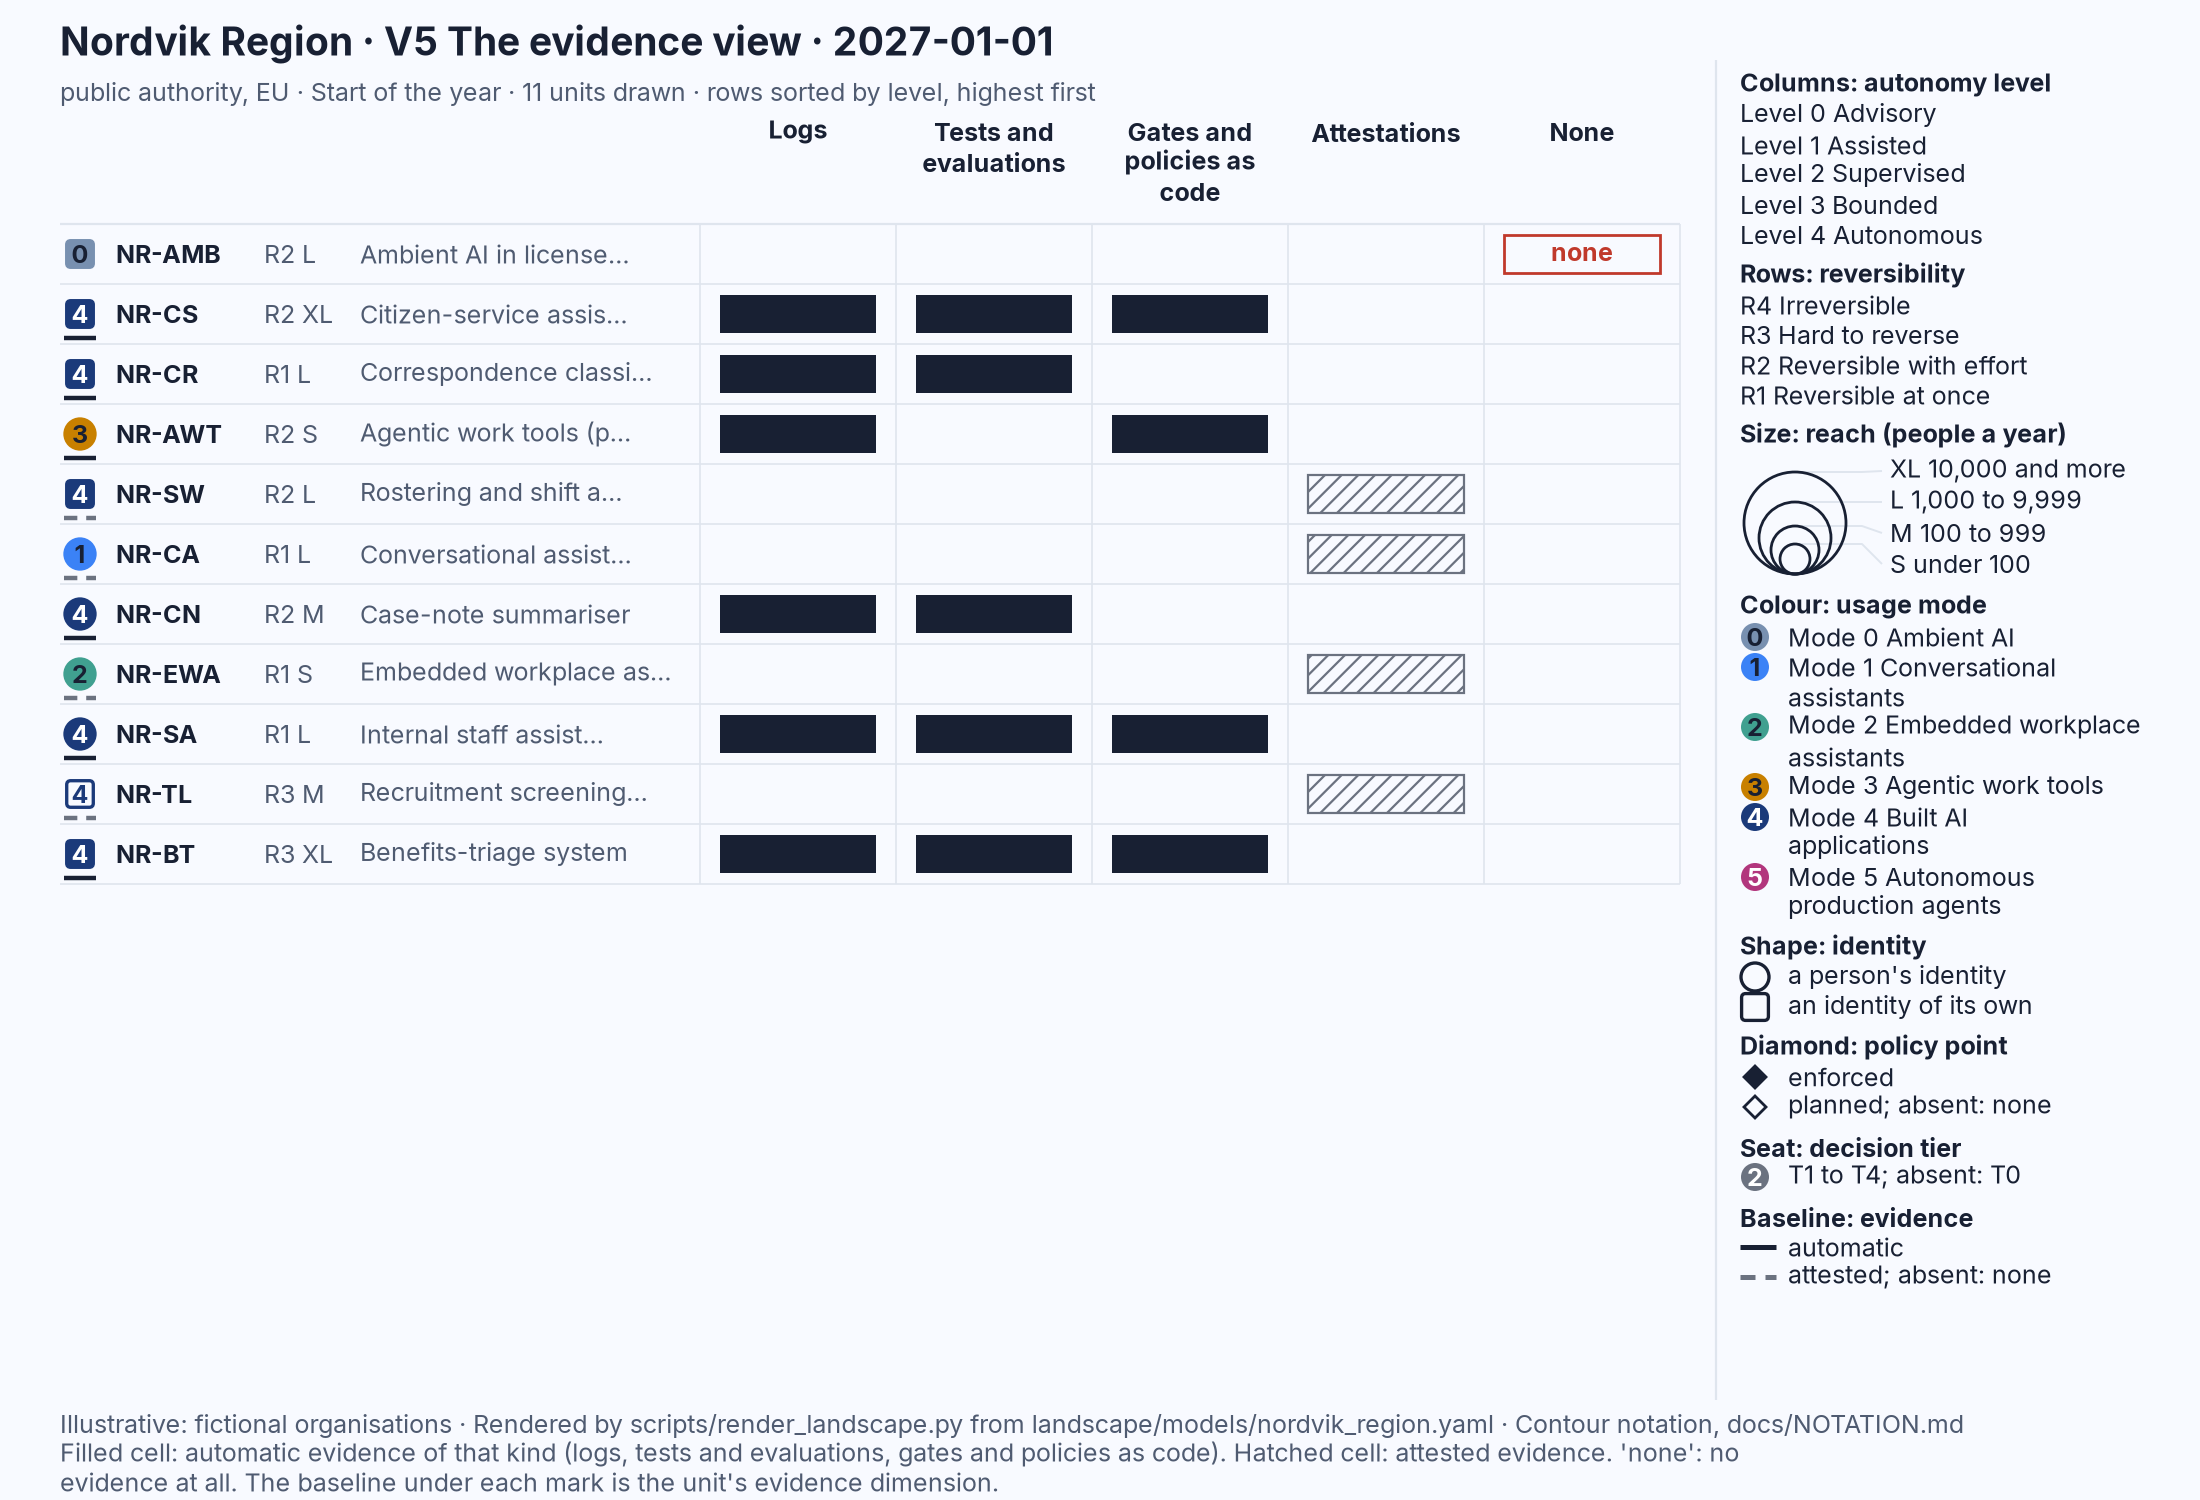
Figure 23.5: The renderer's V5 for Nordvik Region on 1 January 2027: one row per unit, the four evidence columns and the "None" column, filled cells for logs, tests and gates, hatched cells for attestations, and one row with no evidence. Illustrative: rendered from landscape/models/nordvik_region.yaml.
Three mistakes people make when they sketch V5:
- Filling a cell because the evidence exists somewhere. The cell is filled when the kind of evidence is produced for this unit: this unit's logs retained, this unit's tests run, this unit's policies enforced in code. A platform that keeps logs in general, or a test suite for a different release, fills nothing. The view is strict so that the solid baseline on page 1 means something.
- Filling the attestations cell, or hatching a policy document into the first three columns. A policy document is attested evidence, however well written, and is hatched in the fourth column; a signed supplier attestation is attested evidence, however senior the signature. Only what the system produces is filled. People who sketch the view for the first time often fill every cell they can defend in conversation, and the picture then says that proof exists where only a promise does.
- Leaving the empty row empty. A unit with no evidence should be the loudest row on the page. Left blank, it is indistinguishable from a row the sketcher ran out of time for; with "none" written in the last column and a box around it, it is the first thing the reader asks about, which is what the notation intends.
Page 6: the comparison view (V6)
V6 The comparison view draws two landscapes side by side, at identical scales, identical sizes and identical colours, with one shared legend and a summary strip under each, so that two organisations, or one organisation at two dates, can be compared without either being rescaled to fit.
- Draw two grids of five columns and four rows at exactly the same cell size, side by side on one sheet, with a gap between them wide enough for the legend. Label the rows at the left edge of the left grid only; label the columns under both. Shade the empty corner in both.
- Write a title above each grid: the organisation's name and the number of units drawn, "Hansa Mutual · 17 units", "Nordvik Region · 13 units".
- Fix the four mark sizes once, for both grids, before you draw a mark. If the sheet forces smaller marks than on page 1, make them smaller in both grids by the same factor and keep the ratio of 1 : 1.6 : 2.4 : 3.4.
- Draw each organisation's V1 in its grid, as on page 1, every mark in full, including the retired marks drawn hollow with a cross; they are still units drawn at that date.
- Draw one legend, in the gap between the grids, in the order of page 1. Never draw two legends; the shared legend is what makes the two pictures one.
- Under each grid draw the summary strip, three lines: "Units drawn" with the count; "Per mode", six small discs with the digits 0 to 5 and beside each the number of marks in that mode; "Per level", five small squares with the digits 0 to 4 and beside each the number of marks in that column; then one line of three counts, the marks with a filled diamond, the marks with a seat and the marks with a solid baseline, the last written "of" the units drawn.
- Check the strips against the grids before you show the page: the counts per level must match the marks in each column, including the hollow and crossed ones.
Figure 23.6 is the renderer's version for the two organisations at the end of 2027. Check your sketch against it: two grids of the same cell size, row labels on the left grid only, the legend between them; seventeen marks on the left and thirteen on the right; six plum marks on the left and none on the right; one hollow crossed mark on the right counted among its thirteen; and two summary strips whose last lines read "Filled diamond 16 · Seat 17 · Solid baseline 13 of 17" and "Filled diamond 11 · Seat 13 · Solid baseline 8 of 13".
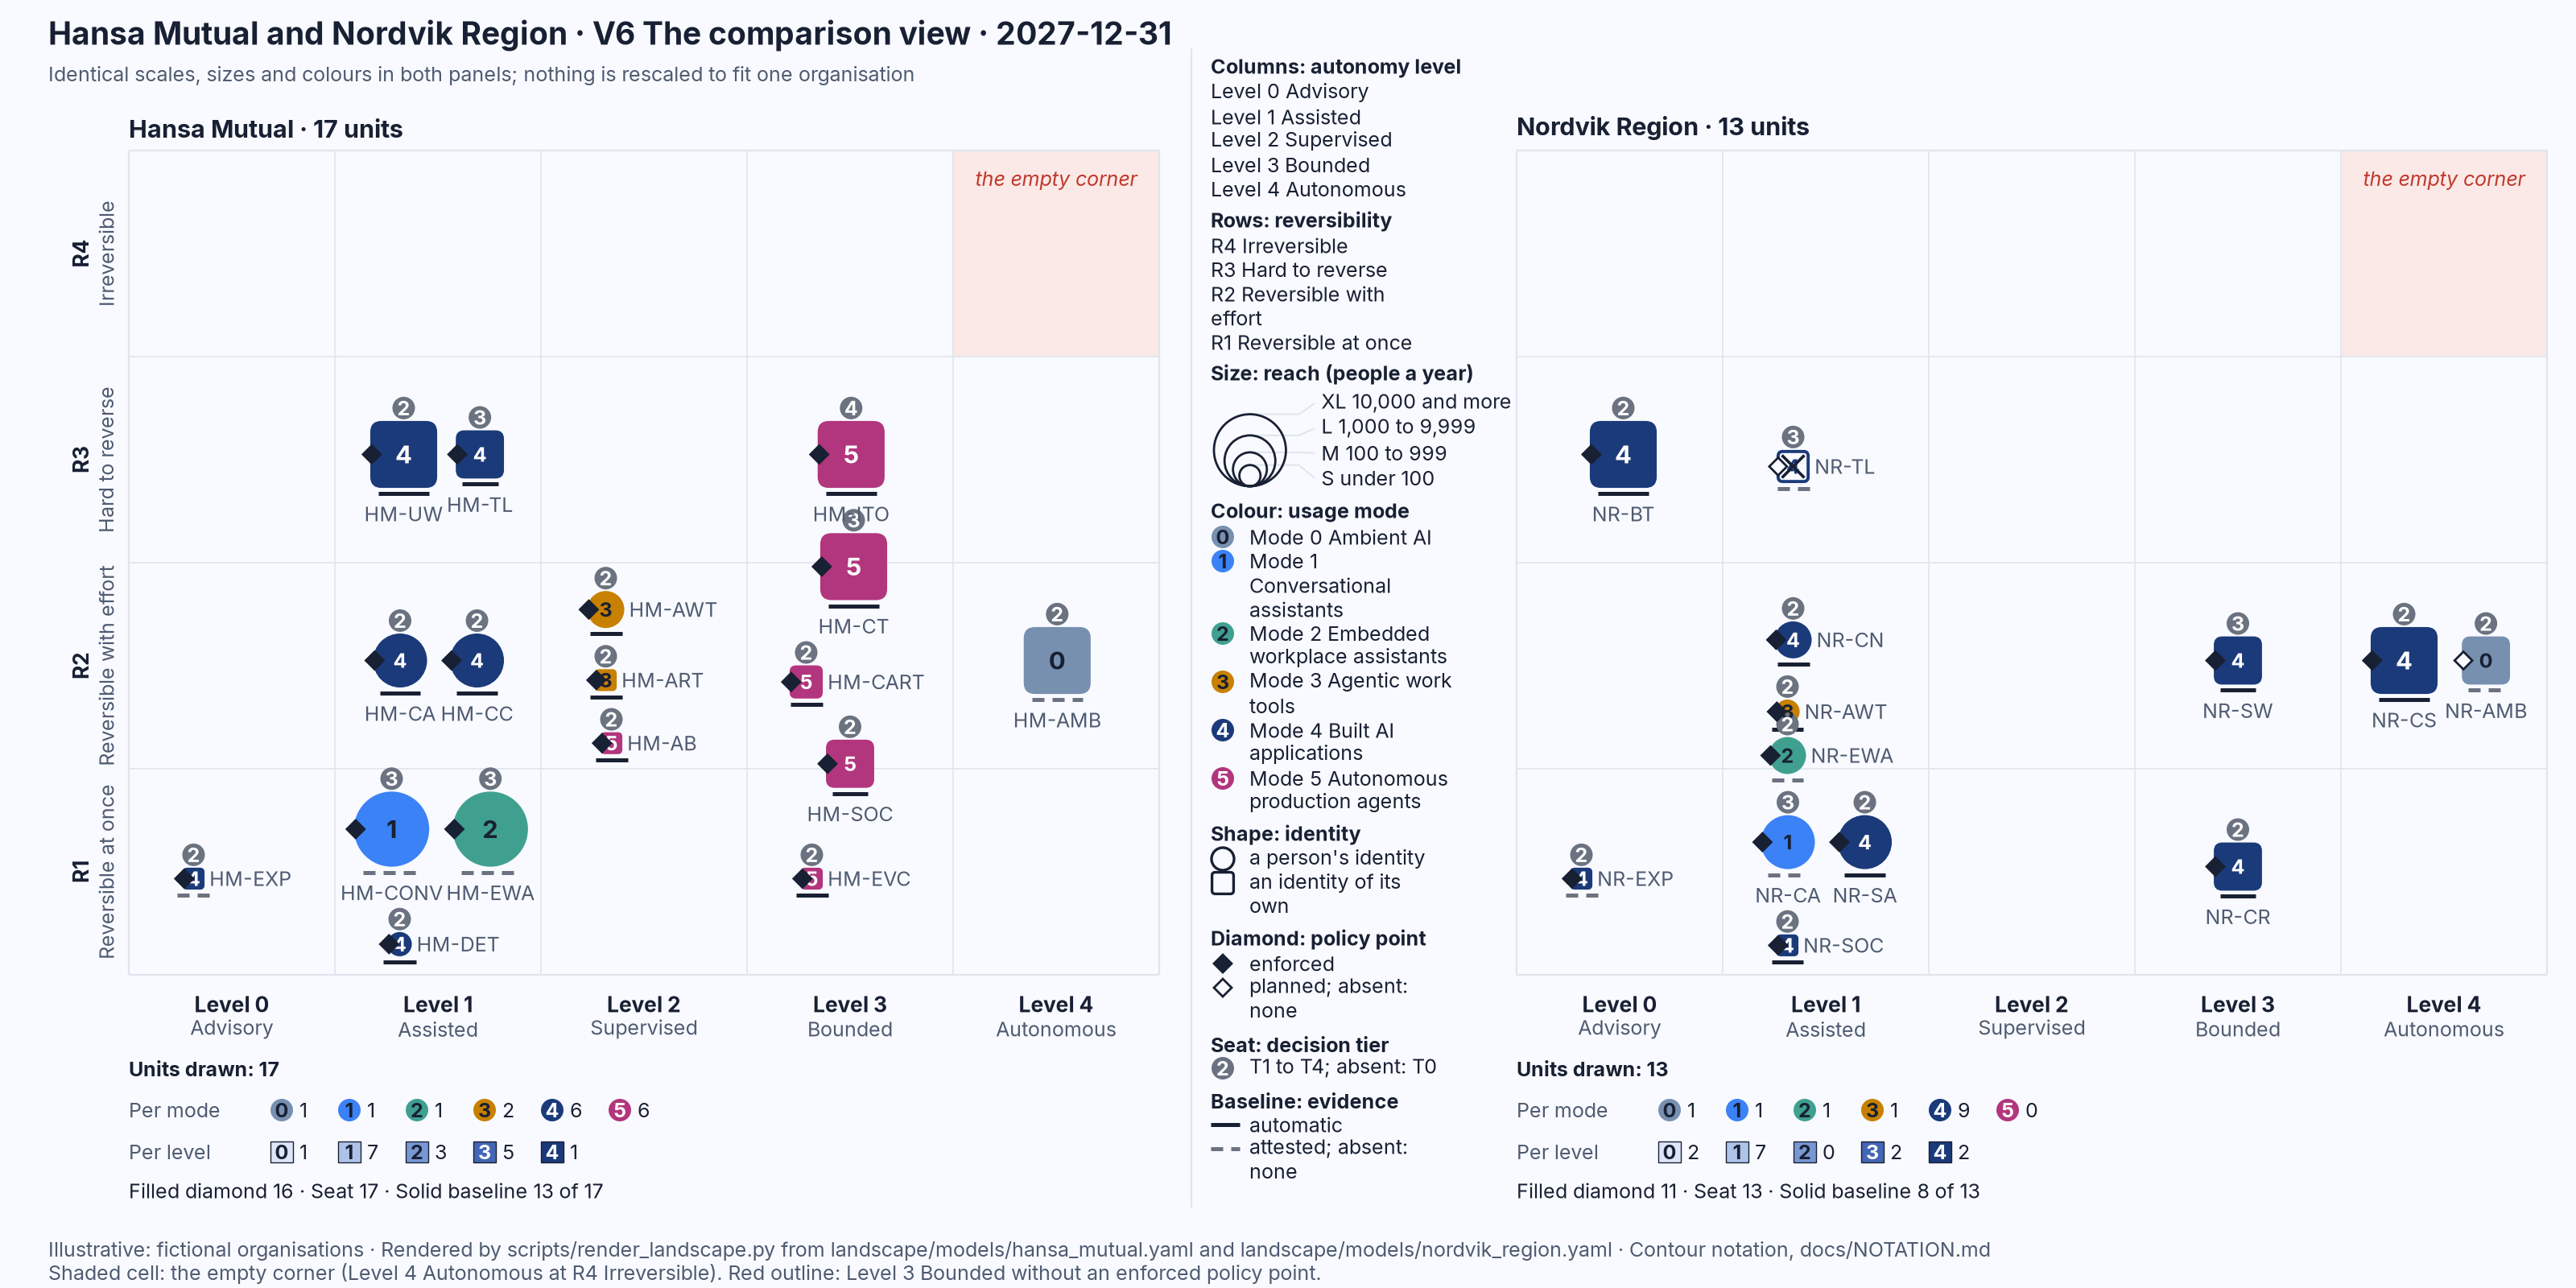
Figure 23.6: The renderer's V6 for Hansa Mutual and Nordvik Region on 31 December 2027: two V1 panels at identical scales, one shared legend and the summary strips with the counts per mode, per level and of diamonds, seats and solid baselines. Illustrative: rendered from landscape/models/hansa_mutual.yaml and landscape/models/nordvik_region.yaml.
Three mistakes people make when they sketch V6:
- Rescaling one side to fit. A grid drawn smaller because its organisation has more units, or marks drawn smaller so that a crowded cell looks tidy, breaks the one promise the comparison frame makes. If the page is too small, draw both grids smaller by the same factor, and if a cell is crowded, let it be crowded; a crowded cell is information.
- Two legends, two dates. A legend under each grid says that the two pictures might mean different things, and a comparison of one organisation in January with another in December says less than it seems to. One legend, one date, written once in the title.
- Reading the strips as a score. The summary strip counts; it does not rank. Seventeen units against thirteen says that one organisation has drawn more of its landscape, not that it has more AI or governs it better, and "Solid baseline 13 of 17" against "8 of 13" is a question about the five and the five, not a league table. The notation draws what is, so that the reader can judge; the judging is the reader's, from the other two chairs as well as their own.
The rules of thumb on one page
The nine rules of thumb of Part II, one per instinct, in chapter order, each taken word for word from its chapter.
The box instinct, Chapter 5: When someone says "the AI" or "the cloud", ask which ones, and count them before you judge them.
The binary instinct, Chapter 6: Ask at which level, for which action: "automated" is five answers, not one.
The model instinct, Chapter 7: Ask what it is used for and who deploys it before you ask which model it is.
The straight-line instinct, Chapter 8: Never extend the last two points; ask what bent the last curve and what could bend this one.
The fear instinct, Chapter 9: When a story frightens you, find the base rate and the quiet harm it hides.
The size instinct, Chapter 10: Never accept a number alone; ask what it is divided by and compared with.
The destiny instinct, Chapter 11: Nothing here is fixed and nothing is inevitable; ask what was decided, by whom, and what it would take to reverse it.
The single-perspective instinct, Chapter 12: Before you decide, read the landscape from the other two chairs.
The blame instinct, Chapter 13: Look for the seat before you look for the culprit; if nobody was named to decide, that is the finding.