The Old Pictures: Boxes, Binaries and the Cloud
Three sentences from one week, none of them quoted from a real document. A tender asks for "an AI system" for case handling. A council debates whether to automate the handling of benefit applications. A strategy says the organisation will move "to the cloud". Each sentence carries a picture: one box with two letters on it, two camps with a person on one side and a machine on the other, one cloud. Behind them sits a fourth, the picture the people who build systems draw, boxes joined by arrows.
Before the book can offer a better picture, it has to show these four, what each was good for and what each hides: the architecture diagram, "the AI system", humans versus machines, and the cloud. Each served well in an earlier landscape and still serves somewhere. Against the data on the present landscape, each hides most of what matters. The data, as Eurostat's enterprise surveys show, lie on scales and not in boxes, and that is why a better picture is possible.
Boxes and arrows
Author's note needed: a short scene, one paragraph, from the author's own practice: a board, steering group or procurement committee shown an architecture diagram of components and arrows, the question somebody asked that the picture could not answer (who decides, whose account this runs under, what changed since last quarter), and what happened next. It sits here, before the diagram is described.
The architecture diagram is the oldest of the four pictures: rectangles for systems or their parts, arrows for the data or the calls between them, a larger rectangle for a boundary. In its disciplined form it shows a system in its setting, then its main parts, then the parts of one of them, all generated from a single model, as Architecture as Code (Chapter 6) describes (1, Nordqvist, 2025). It is a fine instrument for the question it was made for, which is how a system is built.
It was not made for the questions this book asks. Look at such a diagram and try to find a person; usually there is none, or one rectangle labelled "User" at the edge. Try to find who decides what the system may do: an arrow carries data, not authority. Try to find whose identity an arrow travels under, a named employee's permissions or a permission the system holds in its own right; the arrow looks the same either way. Try to find time: a diagram is a photograph of one moment, and the moment is rarely written on it.
Even the careful draw it differently
A reader could grant this and still object that the fault lies with slides and headlines, and that careful practitioners draw the landscape properly. I tested that against my own work. The seven volumes of The Transformed Architecture were written with one style guide, one palette and one pair of example organisations, and in November 2026 a script counted and classified their diagram files. The survey is my own and is not published elsewhere; Appendix C gives its method and limits. The counts of files, forms, shapes, colour classes and legends are exact; the subject counts come from keyword matching of labels and are approximate.
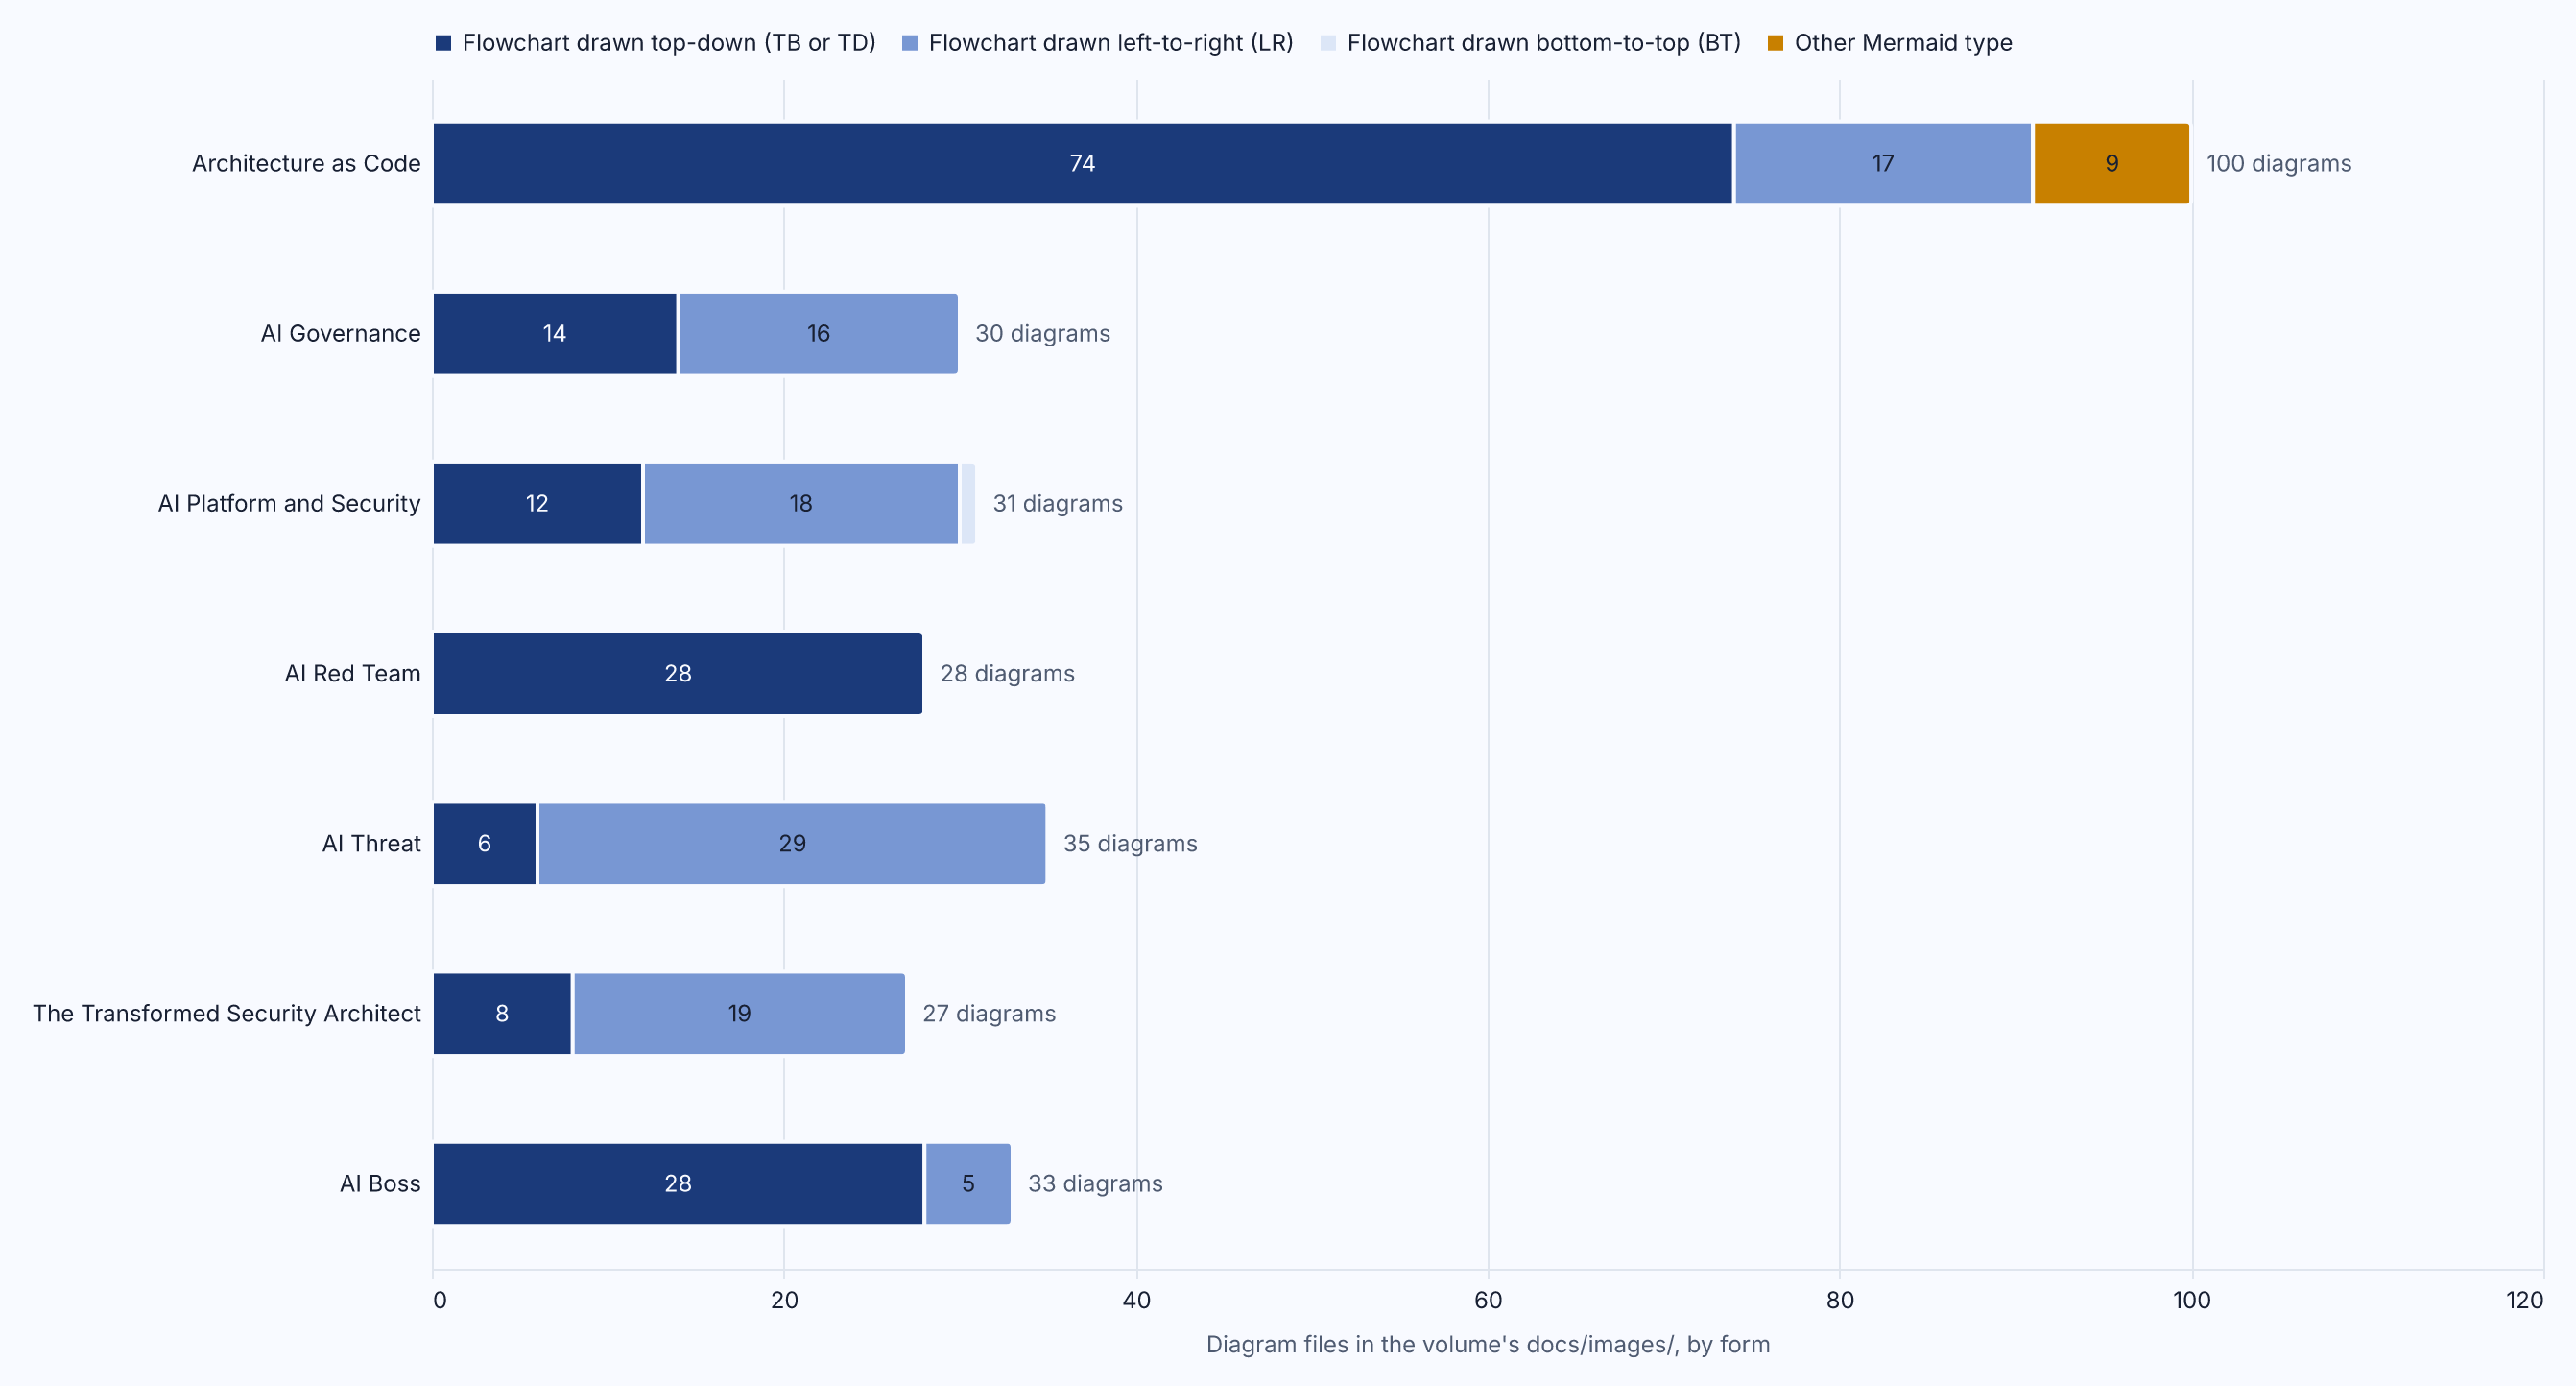
Figure 2.1: The 284 diagrams of the seven volumes by form; 275 are flowcharts, and the nine of any other type all belong to the first volume. Source: the author's survey of the diagram files of the seven volumes (surveyed 2026).
There are 284 files, and 275 are flowcharts. In them the rectangle is almost the only shape: 274 use it, 32 use a rounded stadium (all in Architecture as Code), 22 use the diamond and no other shape appears in more than two. A person, an agent, a model, a supplier, a policy point, a log and a quarter of a year are all rectangles, told apart by their labels, their groups and one of a handful of fills. In one diagram of AI Red Team, Chapter 14, a person and an agent that acts with an identity of its own are two identical rectangles in the same colour (4, Nordqvist, 2026). The six later volumes contain 184 flowcharts and use only the rectangle and, in 16 diagrams, the diamond, plus one hexagon. Direction is house style, not meaning: of the flowcharts 170 run top-down, 104 left-to-right and one bottom-to-top, and the choice follows the volume, as AI Red Team draws all 28 of its diagrams top-down and AI Threat 29 of its 35 left-to-right (5, Nordqvist, 2026).
Colour is the finding I find hardest to defend. The volumes share six colour classes, defined by rank and not by what they denote, and none of the 284 diagrams carries a legend. In consequence the same grey marks the ambient usage mode in AI Governance (2, Nordqvist, 2026) and production systems in AI Platform and Security (3, Nordqvist, 2026). A reader who learnt in one chapter what the grey meant was misled by it in the next.
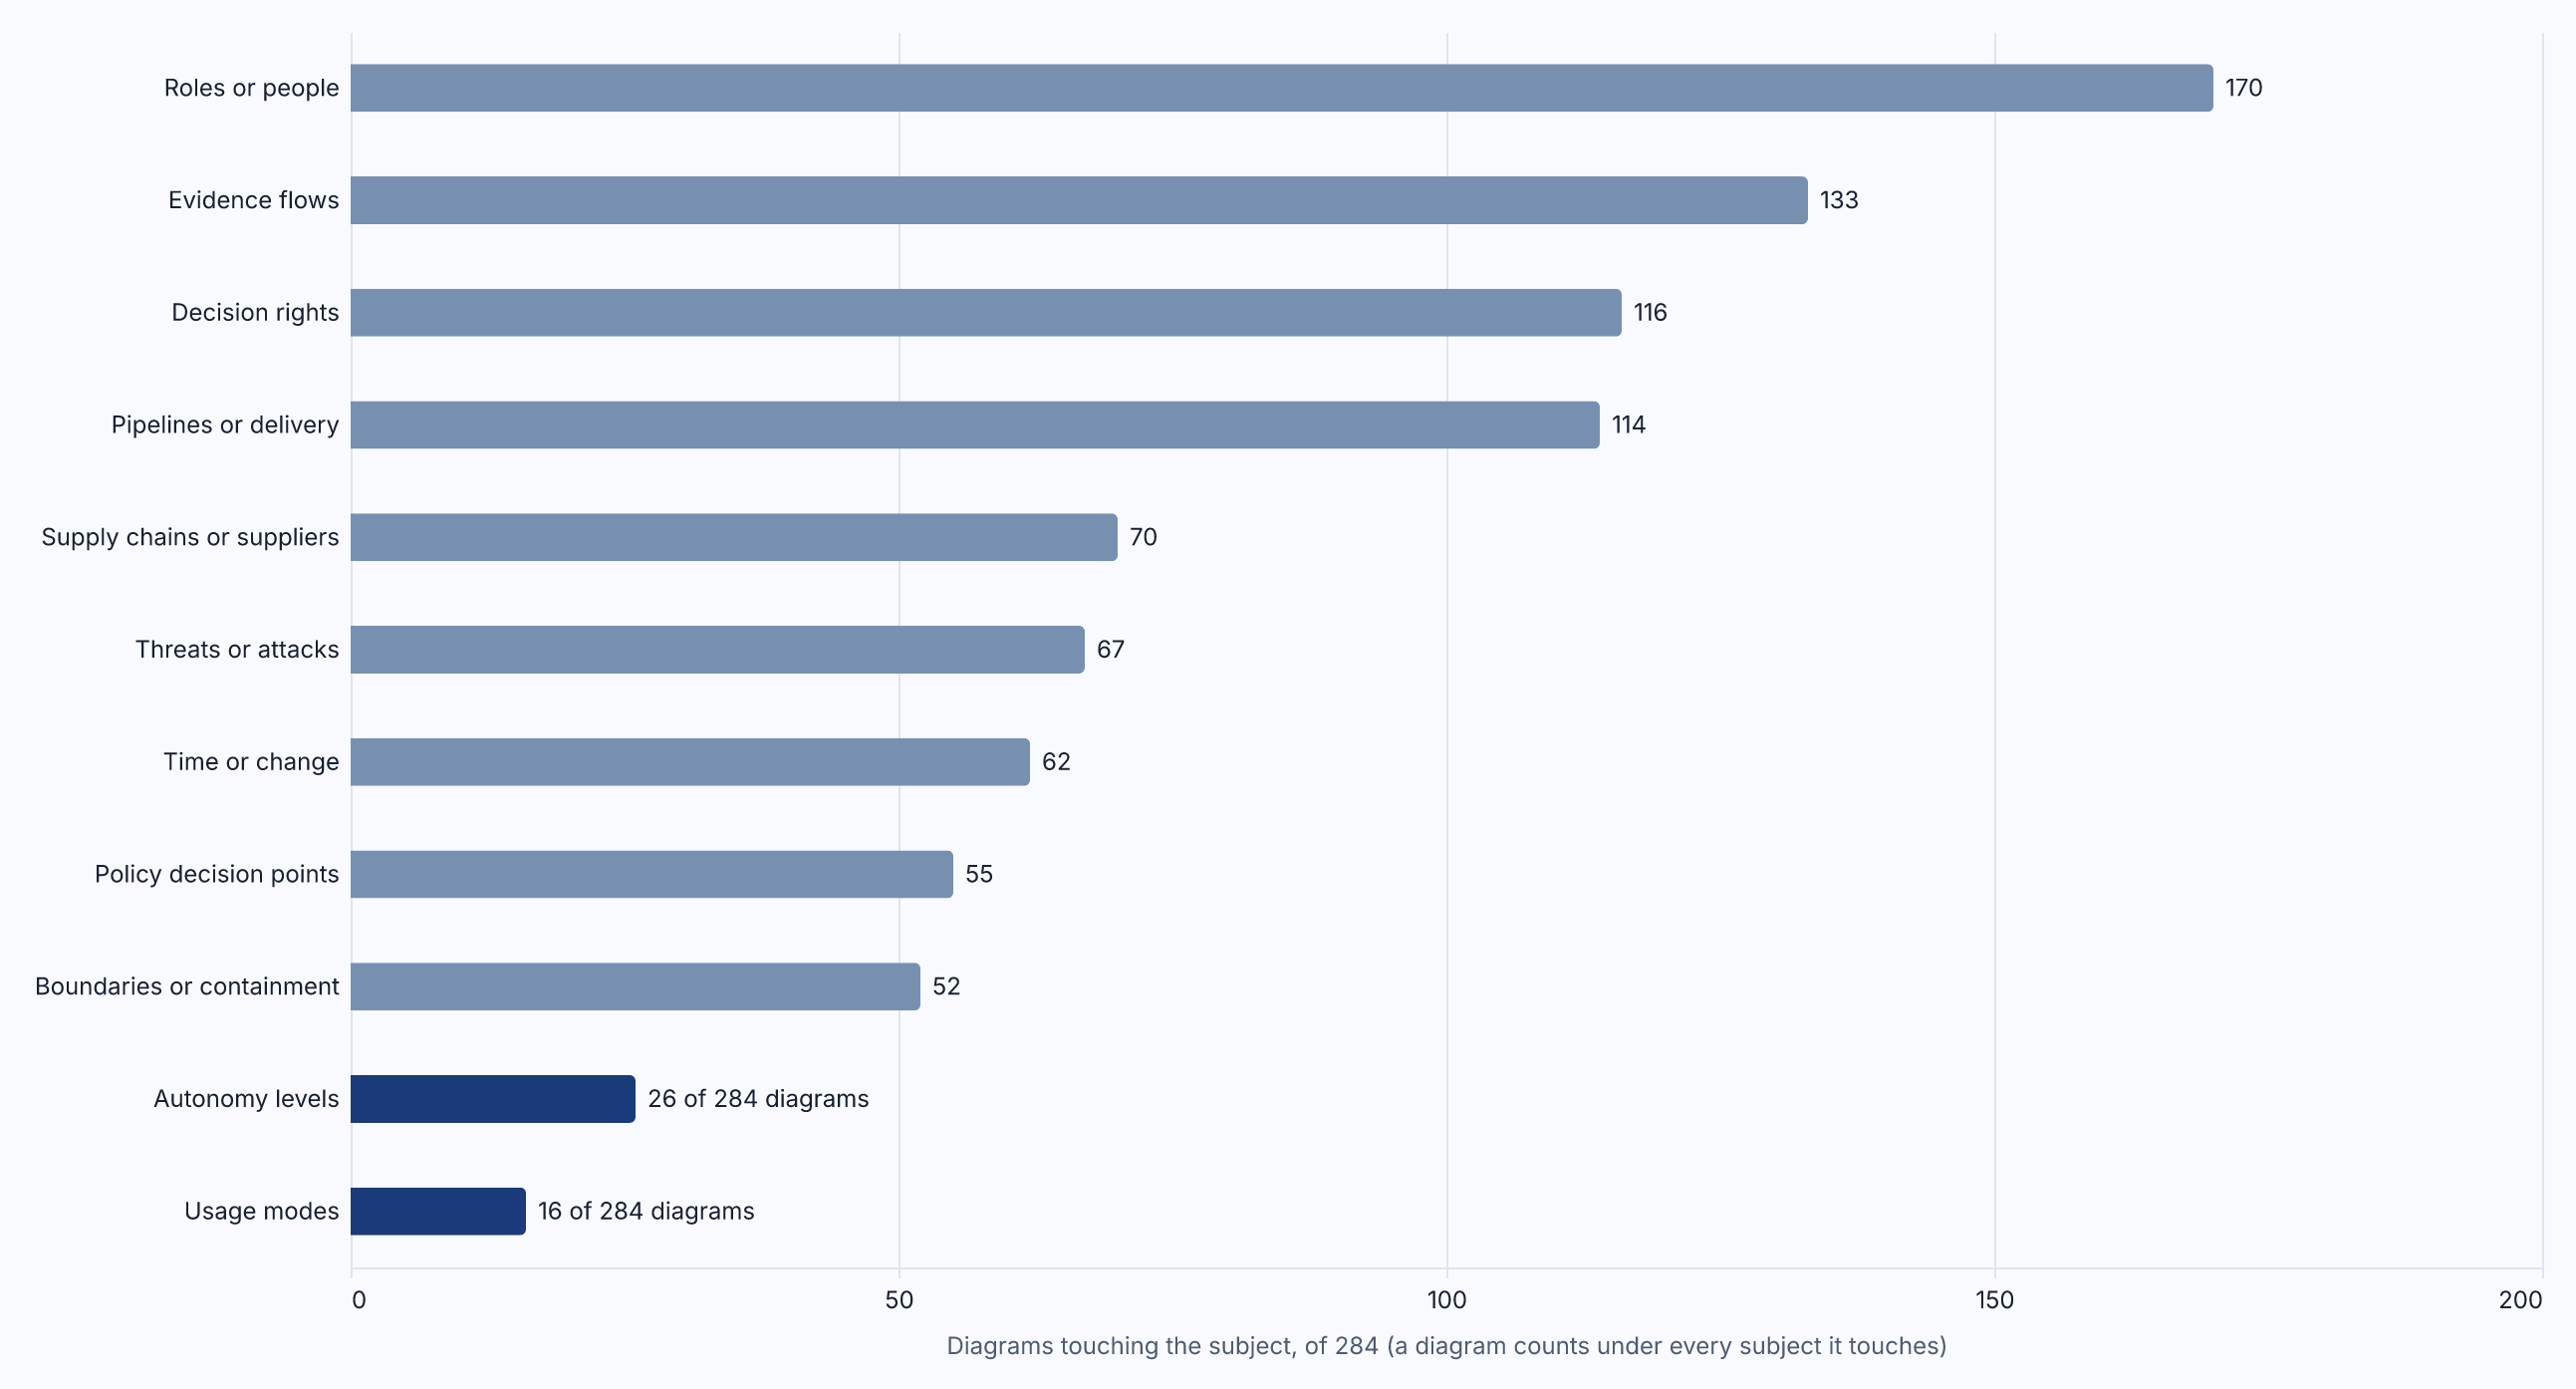
Figure 2.2: The number of the 284 diagrams that touch each recurring subject; a diagram counts under every subject it touches, so the bars do not add up to 284, and the two dimensions the series insists on most, the usage mode and the autonomy level, are drawn as such in the fewest diagrams. Source: the author's survey of the diagram files of the seven volumes (surveyed 2026).
Figure 2.2 shows the subjects. People and roles appear in 170 diagrams, evidence in 133, decision rights in 116, suppliers in 70, time or change in 62, policy decision points in 55 and boundaries in 52, each drawn in several incompatible ways: the policy decision point alone is a diamond, a rectangle inside a layer, a rectangle outside every group and a box merged with a gateway. The usage mode and the autonomy level appear in 16 and 26 diagrams, mostly as words inside a rectangle, and no diagram shows a level or a mode changing. Even the organisation that appears in every volume, Nordvik Region, is drawn in the closing comparison diagram of each of the six later volumes in six layouts, with six assignments of colour, in both directions across the page. In the 172 diagrams that group boxes inside a box, the outer box means a security boundary in one, a time period in the next and a category of law in a third. Care in the single picture does not produce comparability across pictures. I do not report this to disown the diagrams; each does its local work.
The AI system
The second picture is simpler still: a rectangle, inside it the letters "AI", around it the rest of the organisation.
The best measured evidence that it is not one thing comes from Eurostat, which has asked enterprises in every member state about AI since 2021 in its survey of ICT usage in enterprises. The survey covers enterprises with ten or more persons employed outside the financial sector, about 1.53 million of them in 2025, and its results are percentages of enterprises (9, Eurostat, 2026). The headline for 2025 is that 19.95 per cent of those enterprises used at least one of the AI technologies on Eurostat's list and 79.09 per cent used none (9, Eurostat, 2026). That is the box: one in five has it. Everything interesting is in the list.
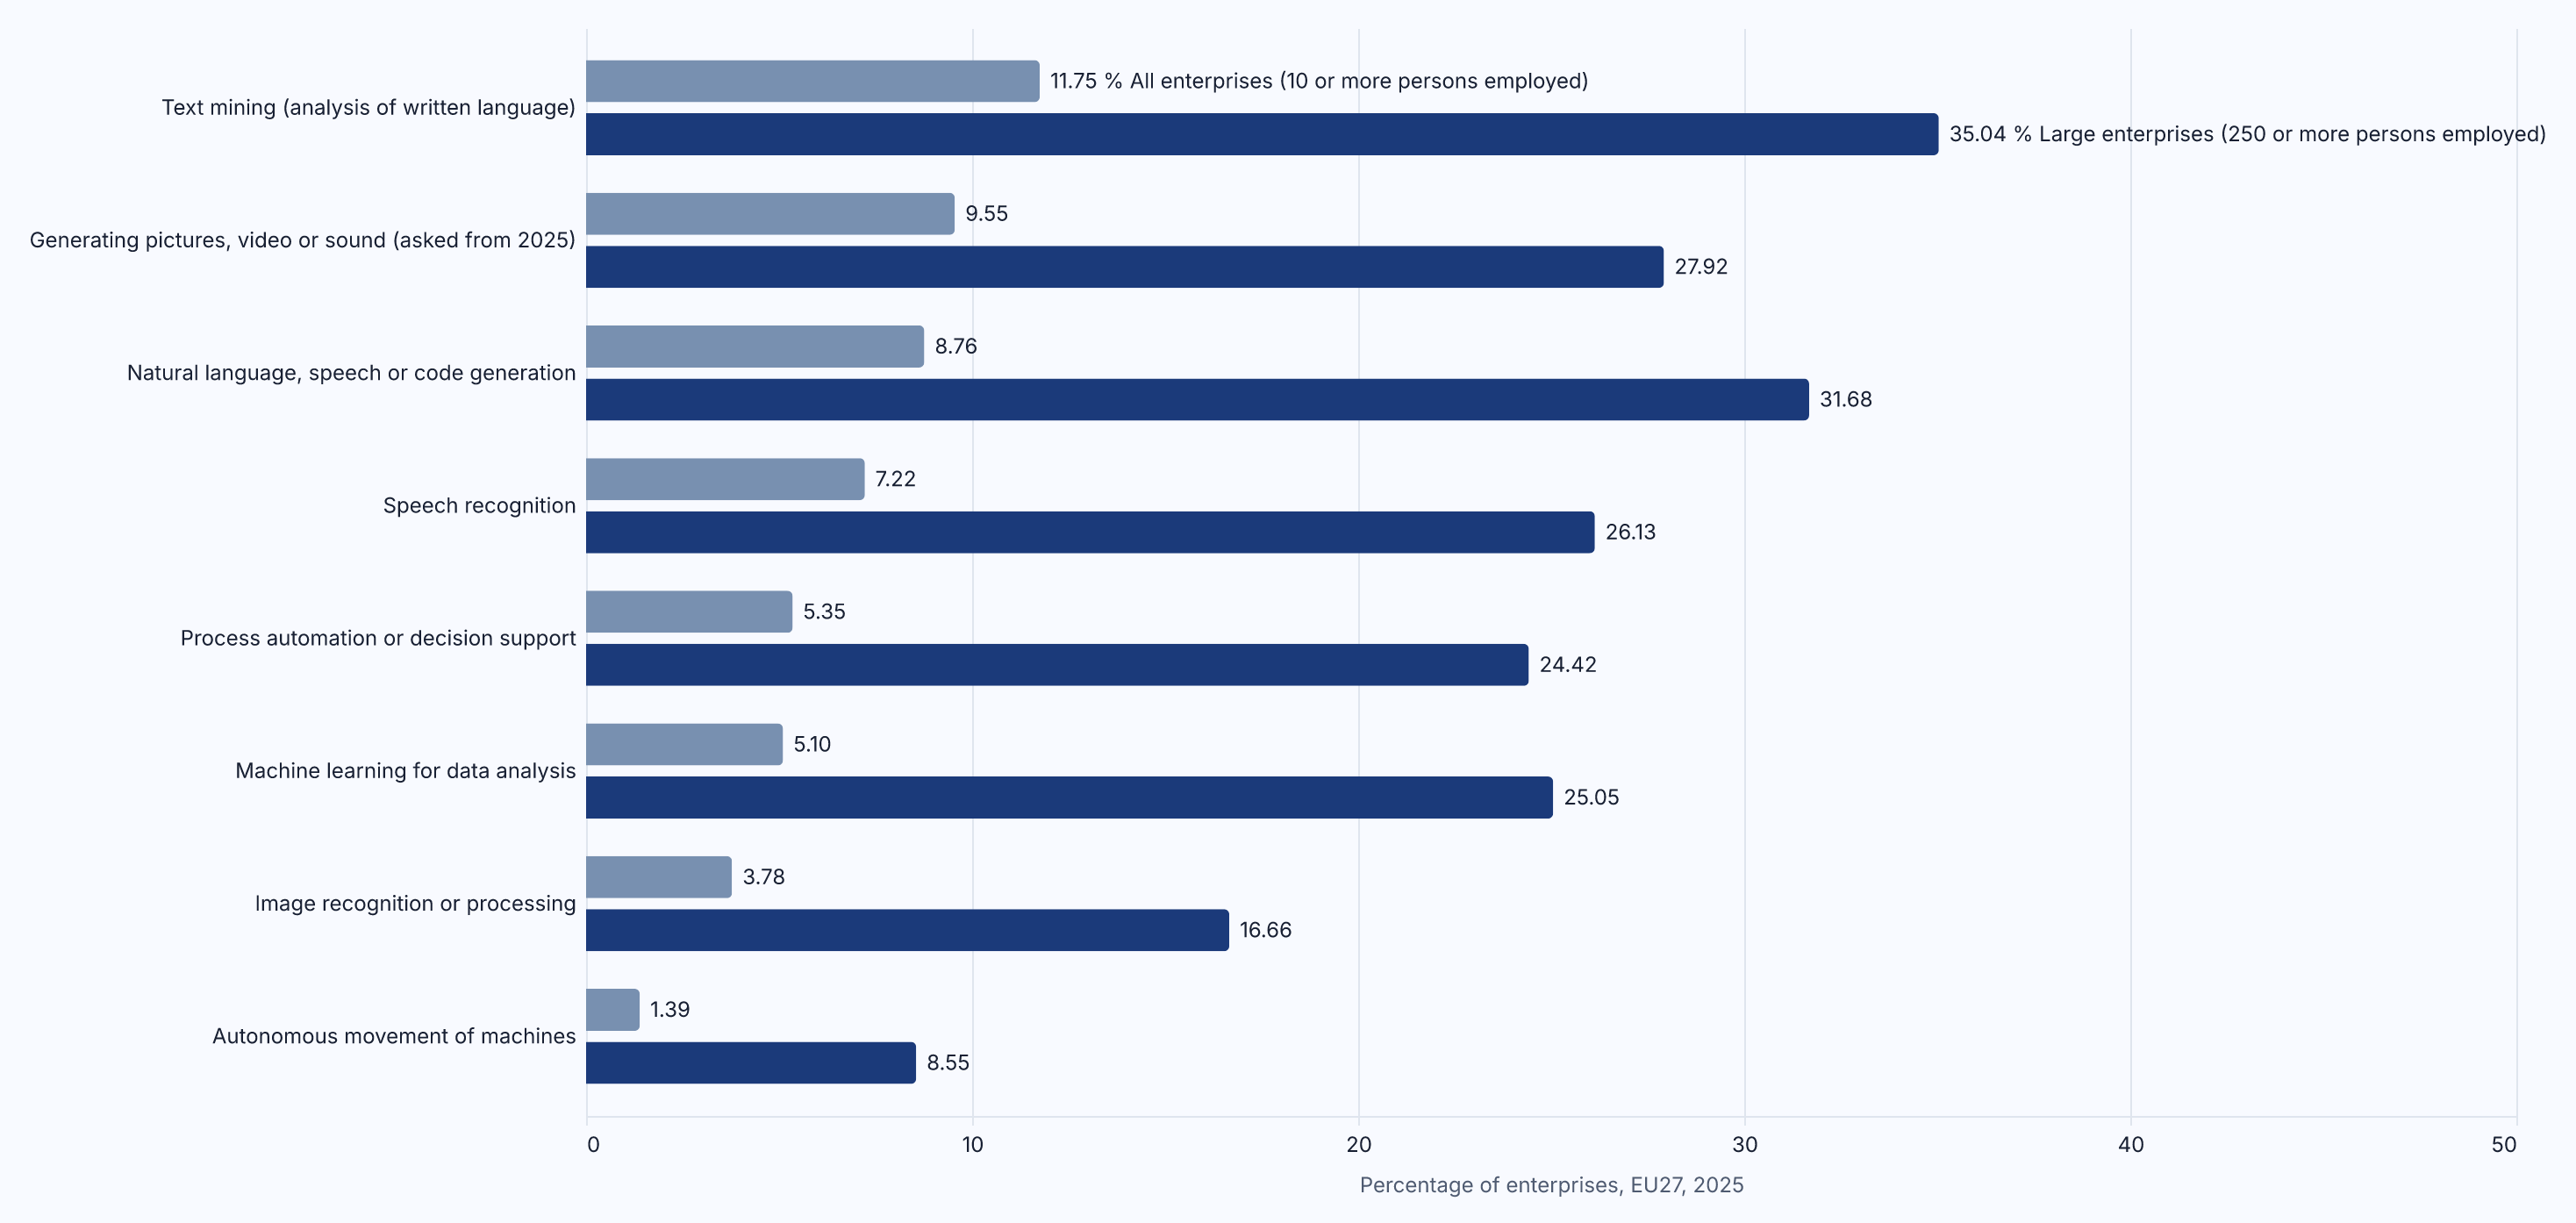
Figure 2.3: The eight AI technology types Eurostat asks about and the share of EU enterprises using each in 2025, for all enterprises with ten or more persons employed and for large enterprises; generating pictures, video or sound was asked for the first time in 2025. Source: Eurostat, Artificial intelligence by size class of enterprise, isoc_eb_ai, 2025 (retrieved 2026).
Eurostat does not ask "do you use AI". It asks about eight technologies, one at a time, and the shares are not alike. In 2025, 11.75 per cent of enterprises used AI for the analysis of written language, which Eurostat calls text mining; 9.55 per cent used AI that generates pictures, video or sound, asked about for the first time that year; 8.76 per cent used AI that generates written or spoken language or programming code; 7.22 per cent used speech recognition; 5.35 per cent used AI that automates workflows or assists in decision making; 5.1 per cent used machine learning for data analysis; 3.78 per cent used image recognition; and 1.39 per cent used AI that moves machines autonomously (9, Eurostat, 2026). The most common technology is used by more than eight times as many enterprises as the least common. Among large enterprises, with 250 or more persons employed, 55.03 per cent used at least one, the shares are higher throughout, and the most and least common types are the same, text mining at 35.04 per cent and autonomous movement at 8.55 per cent (9, Eurostat, 2026).
Question 4 asked how many of them an AI-using enterprise uses. Eurostat gives 8.28 per cent of all enterprises using three or more, and dividing by the 19.95 who used any, which is my estimate and not a published figure, gives about four in ten of the users (9, Eurostat, 2026). Question 10 asked what the AI is for. Among AI-using enterprises the measured answer is marketing or sales, at 34.7 per cent, but among large AI-using enterprises ICT security comes first, at 47.51 per cent (9, Eurostat, 2026). The answer changes with the population, and the one box cannot hold the difference. Chapter 5 gives both answers in full. One caution belongs here: the eighth technology was added in 2025, so the 2025 share rests on a longer list than the 2024 share of 13.48 per cent, and some of the rise may come from the wider question (9, Eurostat, 2026). The caution does not rescue the box. Even the official statistician, who has to count something, counts eight technologies and seven purposes and not one thing.
Humans versus machines
The third picture has two boxes. On the left a person, on the right a machine, and the question is which will do the work. A procurement form asks whether the system is automated, yes or no. The picture is older than computing and was once a fair description.
It is a poor description of the data. The type on Eurostat's list that comes closest to the machine doing the work, AI that automates workflows or assists in decision making, is one question that joins the two halves of the binary in a single phrase: automating and assisting are counted together, at 5.35 per cent of enterprises in 2025 (9, Eurostat, 2026). The only type in which a machine unmistakably acts alone, autonomous movement, is used by 1.39 per cent of enterprises and 8.55 per cent of large ones. The most common types, text mining and the generation of text or media, produce something a person can read, check or use. The survey does not ask who decides, so this is my reading of what the types are, not a measurement of how they are used.
The scale that replaces the two boxes is the autonomy level, what an AI may do without a person approving each action. AI Red Team, Chapter 6, defines five, from Level 0 Advisory, where the AI suggests and a person decides and acts, to Level 4 Autonomous, where it acts within bounds set in advance; Chapter 4 gives all five (4, Nordqvist, 2026). The same volume concludes that the line that matters most runs between Level 2, where a person approves each action, and Level 3, where the AI executes pre-approved actions within a written playbook and a person can stop it, because above that line a class of actions happens without anyone approving each one. The human-or-machine picture puts one line where the landscape has four, and puts it in the wrong place: between Level 0 and everything else, when the consequential line is two steps further along. Chapter 6 returns to the binary with the data on individuals and developers.
The two boxes hide a second thing: whose identity the machine acts with. An assistant drafting inside a person's mailbox acts with that person's permissions, while an agent filing a claim in a production system acts with permissions of its own, which makes it, in the vocabulary of AI Red Team, a privileged insider that happens to be a machine (4, Nordqvist, 2026). Both are "the machine" in the two-boxes picture, and in any question of accountability, security or law they are different things.
The cloud
The fourth picture is the cloud drawn on a whiteboard with a bumpy outline. Things move "to the cloud"; a strategy is "cloud first"; a risk register has one line for "cloud dependency". The picture is honest about one thing, that the computing is somewhere else, and silent about everything that follows from where.
Eurostat has asked enterprises about paid cloud computing services since 2014. The headline for 2025, 52.74 per cent of enterprises with ten or more persons employed, is the measured answer to Question 5, which Chapter 5 takes up (10, Eurostat, 2026).
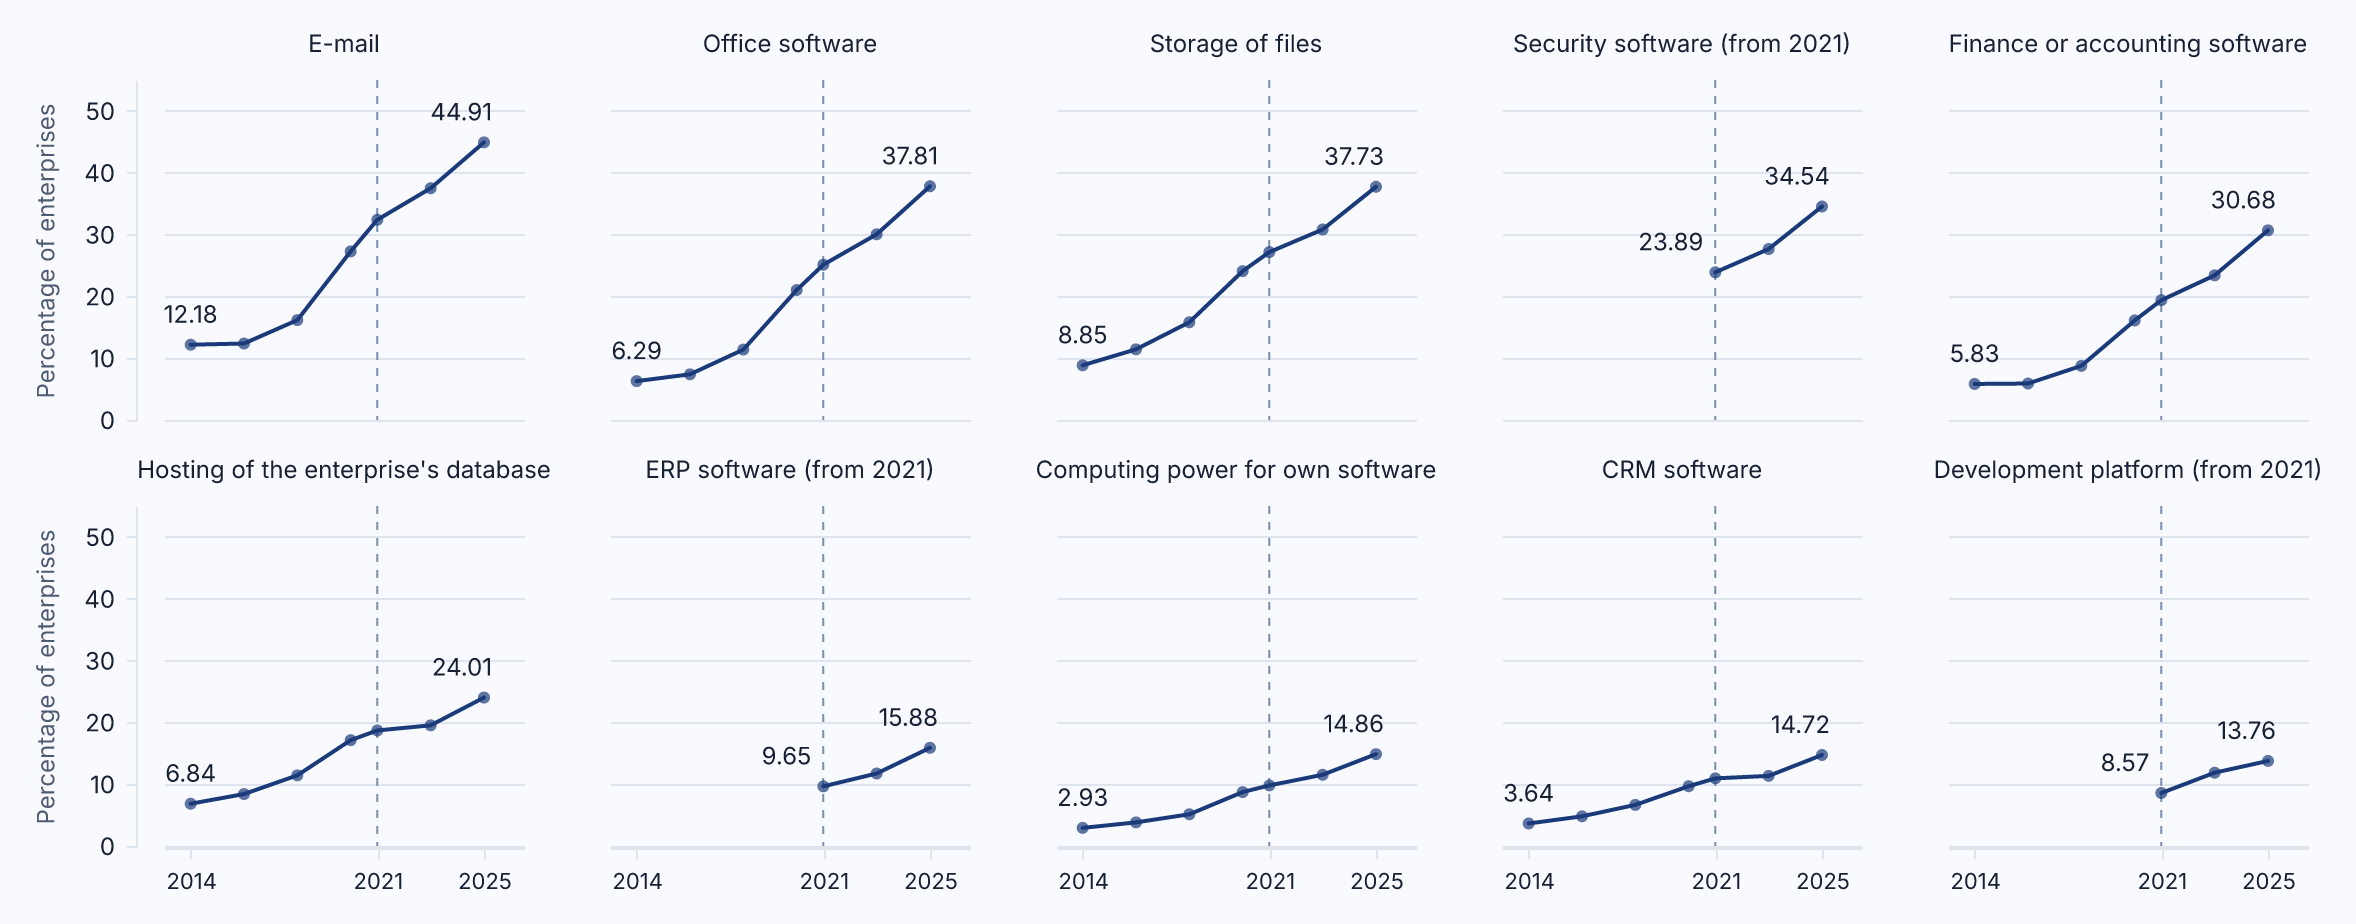
Figure 2.4: The share of EU enterprises with ten or more persons employed buying each type of paid cloud computing service, 2014 to 2025, one panel per service type; three types were added when the question list was extended in 2021 and start there. Source: Eurostat, Cloud computing services by size class of enterprise, isoc_cicce_use, 2014 to 2025 (retrieved 2026).
Look instead at the list. In 2025, 44.91 per cent of enterprises bought e-mail as a cloud service, 37.81 per cent office software, 37.73 per cent storage of files and 34.54 per cent security software; 30.68 per cent bought finance or accounting software, 24.01 per cent hosting of their own database, 15.88 per cent enterprise resource planning software, 14.86 per cent computing power to run their own software, 14.72 per cent customer-relationship software and 13.76 per cent a development platform (10, Eurostat, 2026). The services nearest to building and running one's own software are among the three least bought; the services bought by most enterprises are mail and documents, hosted by somebody else. The picture also moves, and the one cloud cannot show movement. In 2014, 12.18 per cent of enterprises bought e-mail from the cloud and 2.93 per cent computing power, and every service asked about since has risen, at different rates. Three services (security software, enterprise resource planning and the development platform) were added in 2021, which the chart marks with a dashed line. The Commission measures the Digital Decade target for cloud, the EU's 2030 digital target, on intermediate and sophisticated services only, and on that definition the 2025 share is 46.69 per cent rather than 52.74 (10, Eurostat, 2026) (15, European Commission, 2026).
What the one cloud hides most completely is not in Eurostat's table at all, because the table counts services, not places. A cloud service runs in a data centre, in a country, under a provider's contract and a jurisdiction's law, and for a public authority or an insurer those facts decide which obligations attach to the data that goes there; Chapter 16 draws supplier and jurisdiction on the organisation's own picture. The bumpy outline is not wrong. It is a placeholder for a drawing nobody has made.
Testing a picture: five questions
Any diagram of technology at work can be tested in a minute with five questions. The survey did not apply them to the diagrams one by one, but it did find that no diagram shows a level or a mode changing, which is the fifth question for those two properties.
- Who acts? For each box, say whether a person, software that advises a person or software that acts on its own is meant. If shape and colour do not tell you, the diagram does not.
- With whose identity? For each arrow that reaches a system of record, say whether it travels under a named person's permissions or a permission the software holds in its own right.
- At which level? For each box that does something, say whether a person approves each action, is informed and can stop it, or set the bounds once and walked away.
- Who decides? Find the person who can switch a box off and the body that gave them that right.
- How has it changed? Ask what the picture looked like a year ago and which boxes were added, moved or retired.
What a better picture needs
Rosling's complaint about the world's two boxes, "developed" and "developing", was not that the boxes were offensive but that they were empty: when he put the countries' incomes on a continuous scale, most of the world's people sat where the two-box picture had a gap (8, Rosling et al., 2018). His remedy was four income levels, defined by numbers and drawn the same way in every chart. The method mattered more than the levels: a fixed scale, a fixed meaning for each visual property, and the discipline to draw it the same way every time.
The four old pictures fail for the same reason, and the same remedy applies, because everything they hid lies on a scale. Autonomy runs from advice to action. What it would take to undo an action runs from minutes to never. The number of people an AI use touches in a year is a count. How an organisation came to use a model, from a feature a supplier switched on to an agent it built and set loose, is an ordered list of six usage modes. Whose identity the thing acts with is one of two values, and who holds the decision, and where the proof of control comes from, are each a small set of states.
A better picture therefore needs fixed scales, the same columns, rows and sizes in every drawing, so that a mark drawn in January can be laid over one drawn in December and one organisation's picture can be laid beside another's. It needs fixed meanings: a shape that always means the same kind of actor, a colour that always means the same mode, and a legend that travels with every picture. It needs the right unit: not a product or a vendor but one AI use, drawn once. It needs to carry on the mark itself the properties the old pictures left out: who acts, with whose identity, at which level, under whose decision, with what proof. It needs time and comparison as first-class drawings. And it needs to be drawable by hand on a whiteboard in five minutes and rendered exactly from a model kept as code, which follows what Architecture as Code (Chapter 6) concluded about architecture diagrams in general: generate the views from a single model and keep them consistent. Consistent pictures come from a single source of truth, not from consistent draughtsmen (1, Nordqvist, 2025). The survey of the seven volumes is the evidence for that last requirement. Chapter 3 defines the vocabulary such a picture needs, and Chapter 4 teaches the picture itself, Contour.
Nordvik Region and Hansa Mutual
Nordvik Region and Hansa Mutual are the two fictional organisations that Chapter 1 introduced; everything in this subsection is illustrative, rendered from a model, never measured and never used as evidence. In the earlier volumes each was drawn as the survey found everything drawn: rectangles inside a group. The closing diagram of AI Governance, Chapter 23, draws Nordvik Region as four rectangles under the heading of one public-law jurisdiction, one labelled as a procured high-risk system whose controls are held in the contract (2, Nordqvist, 2026). Neither that diagram nor its counterpart in AI Platform and Security shows how many AI uses the Region has, at what level any of them acts, with whose identity, who can switch each off or where the proof of control comes from.
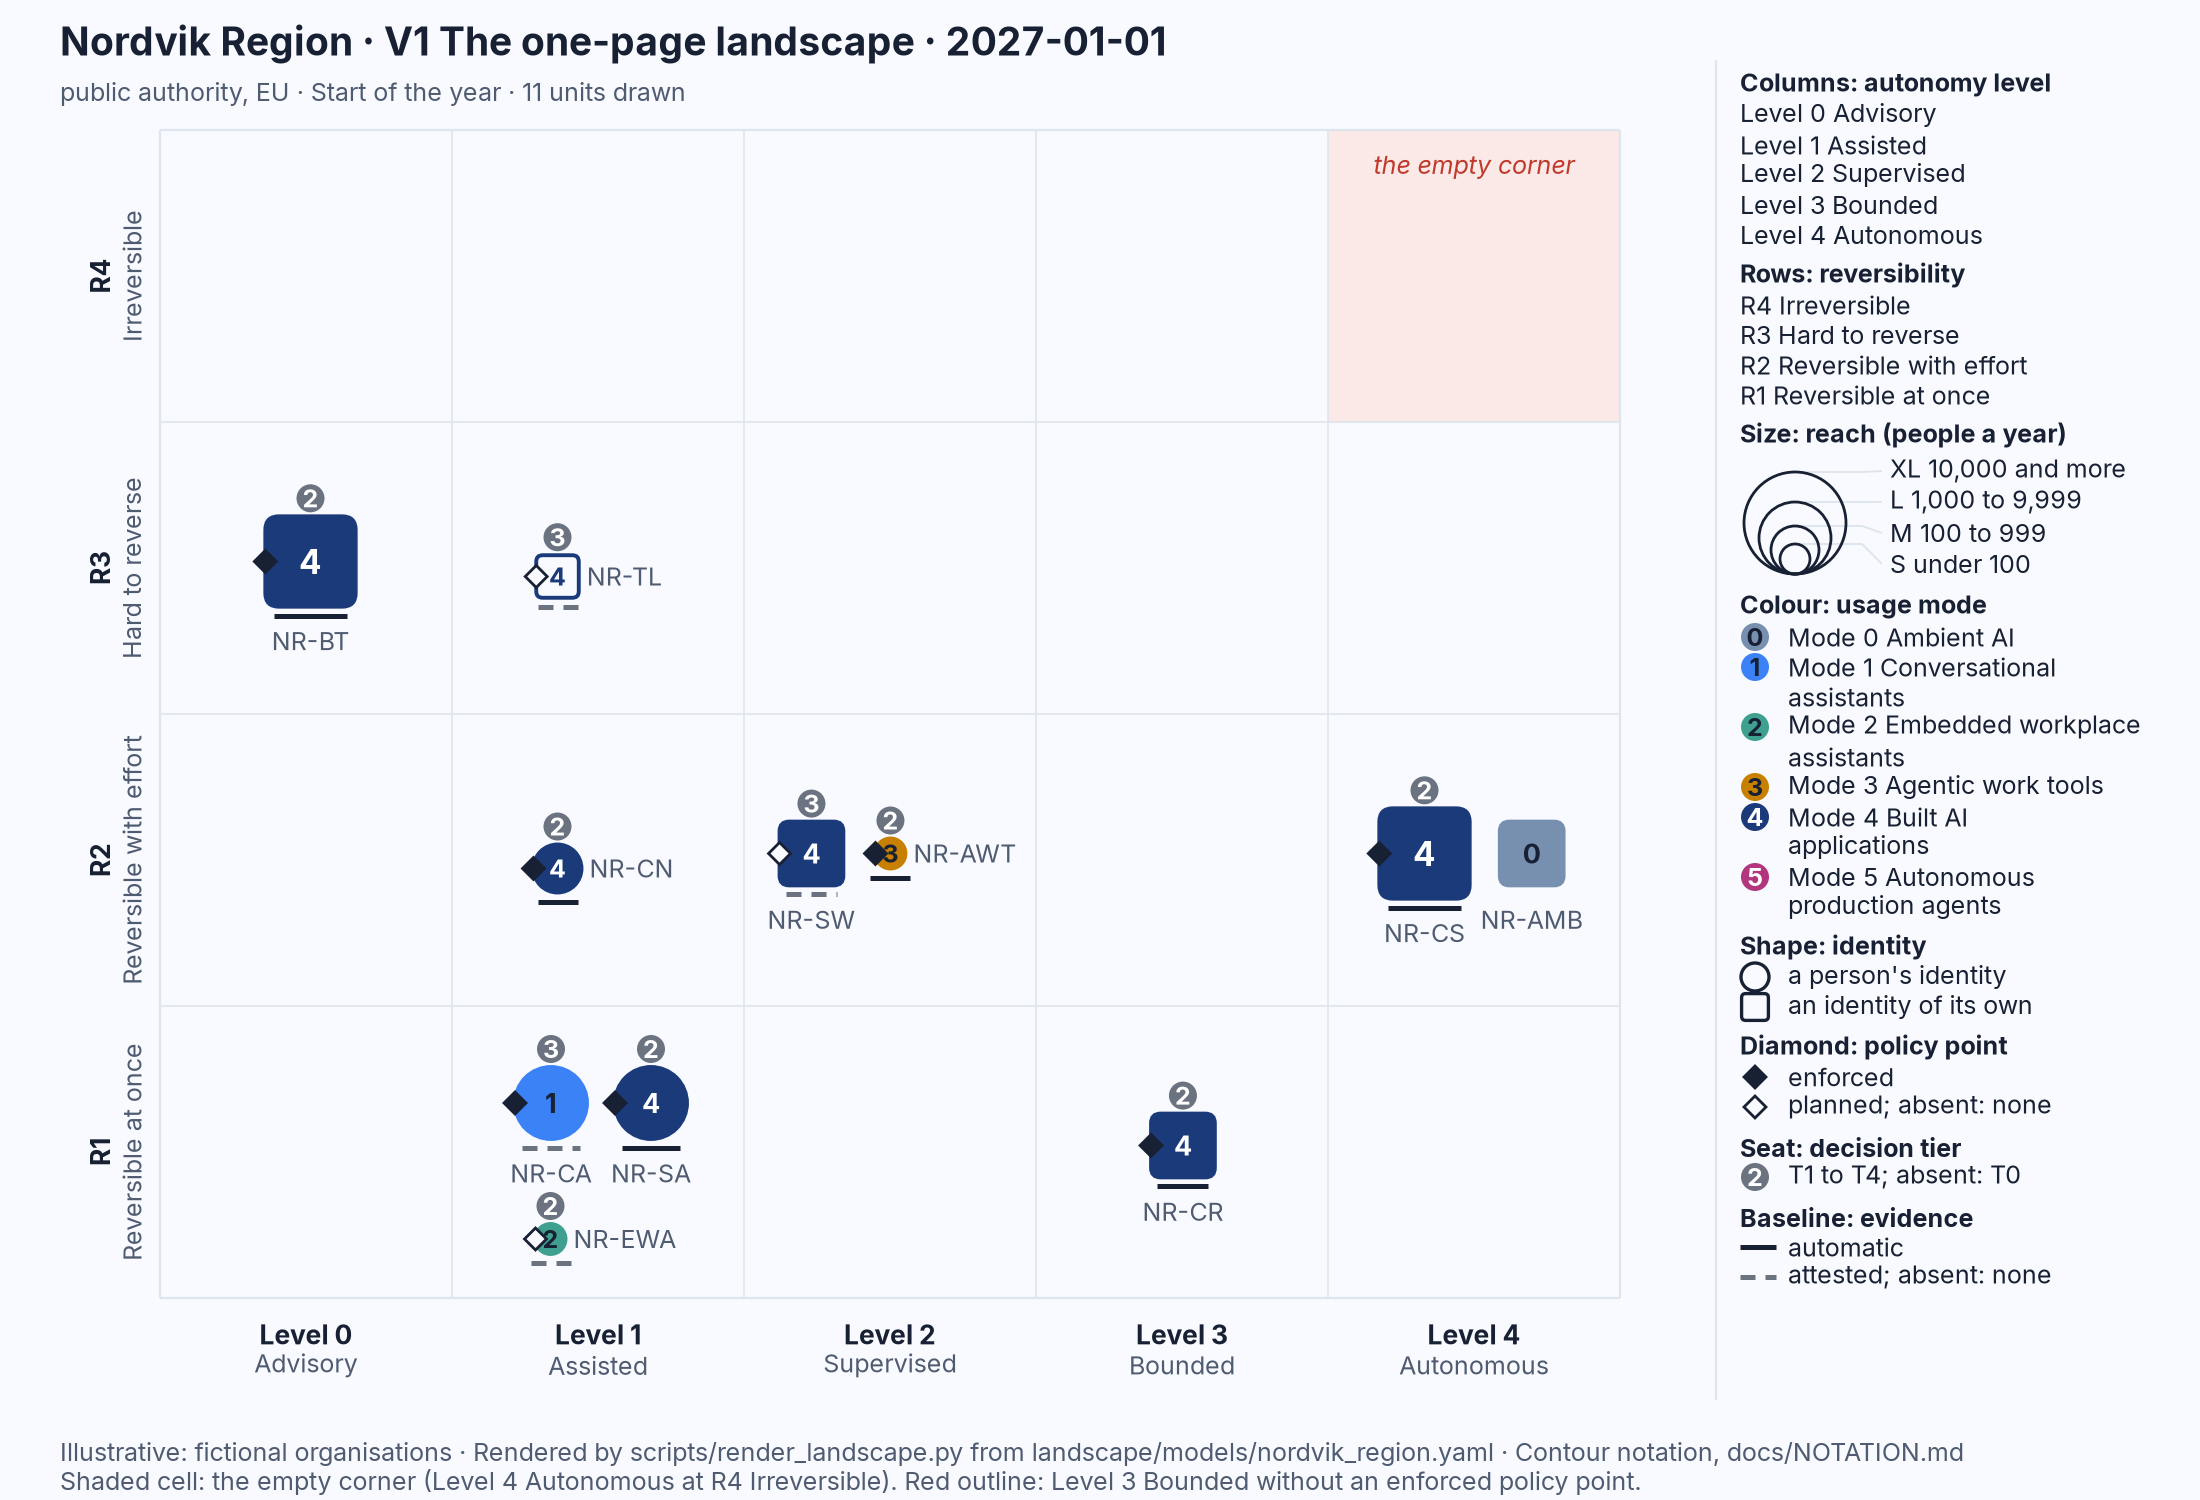
Figure 2.5: Nordvik Region's landscape at the start of 2027, V1: the picture the boxes of the earlier volumes could not show. Illustrative: rendered from landscape/models/nordvik_region.yaml.
Figure 2.5 draws the same organisation on 1 January 2027 in the book's scenario, in the notation that Chapter 4 teaches. Three things are visible before the reader knows a single rule of it, and they are the three things the boxes hid. First, the shaded cell at the top right, which the notation calls the empty corner, is empty: nothing at the Region acts without approval on something that cannot be undone. Second, above every mark but one sits a small grey seat with a number in it, the tier of the person who holds the decision right for that use. Third, the one mark without a seat is the grey square at the far right: the AI features that suppliers switched on inside the Region's licensed software. It sits in the column of highest autonomy because the suppliers chose the level, has no seat because nobody at the Region decided on it, and has no line beneath it because there is no evidence either way. AI Red Team, Chapter 8, calls this ambient AI the blind spot (4, Nordqvist, 2026). Hansa Mutual's landscape, in Figure 1.3, has the same grey square, larger because it reaches ten thousand people or more, and beside it the rounded squares of the agents that act with identities of their own on claims, on IT operations and in the security operations centre, each with a filled policy point and a seat. No earlier picture could show that, because no earlier picture drew both in the same frame.
Summary
This chapter tested the four pictures people carry of technology at work against measured data. The architecture diagram shows what talks to what and nothing about people, identity, decision or time, and a survey of the 284 diagrams of the seven volumes showed that even careful practitioners do not draw the same thing the same way: 275 of 284 are flowcharts, 274 of those use the rectangle for nearly everything, none carries a legend, and the usage mode and the autonomy level are drawn as such in only 16 and 26 diagrams.
The one box labelled AI hides Eurostat's eight technology types, used in 2025 by shares of enterprises from 11.75 per cent down to 1.39 per cent (9, Eurostat, 2026). The picture of humans versus machines puts one line where the autonomy levels put four, and in the wrong place; in Eurostat's questionnaire the only technology in which a machine plainly acts alone is the rarest of the eight. The one cloud hides ten services bought by between 13.76 and 44.91 per cent of enterprises in 2025, a definition on which the headline falls from 52.74 to 46.69 per cent, and, outside the table altogether, the place and the law under which each service runs (10, Eurostat, 2026).
A better picture is possible because everything the old pictures hid lies on a scale or in a short ordered list, which is the lesson of Rosling's four levels (8, Rosling et al., 2018): fixed scales, fixed meanings with a legend, one mark per AI use, the hidden properties carried on the mark, time and comparison in the same frame, and a drawing sketched by hand and rendered exactly from a model kept as code. Chapter 3 defines the vocabulary; Chapter 4 teaches the picture.
Sources
- Nordqvist, G. (2025). Architecture as Code. aac.geon.se. (1, Nordqvist, 2025)
- Nordqvist, G. (2026). AI Governance: Governing Artificial Intelligence in European Enterprises and Public Authorities. aig.geon.se. (2, Nordqvist, 2026)
- Nordqvist, G. (2026). AI Platform and Security: Building and Securing AI Platforms in European Enterprises and Public Authorities. aips.geon.se. (3, Nordqvist, 2026)
- Nordqvist, G. (2026). AI Red Team: AI as an Active Part of Cyber Defence in European Enterprises and Public Authorities. aired.geon.se. (4, Nordqvist, 2026)
- Nordqvist, G. (2026). AI Threat: Are the Dystopias Coming True? Evidence, Risk and Response for European Enterprises and Public Authorities. aithreat.geon.se. (5, Nordqvist, 2026)
- Rosling, H., Rosling, O. and Rosling Rönnlund, A. (2018). Factfulness: Ten Reasons We're Wrong About the World – and Why Things Are Better Than You Think. London: Sceptre. (8, Rosling et al., 2018)
- Eurostat (2026). Artificial intelligence by size class of enterprise. Online data code isoc_eb_ai, retrieved 7 November 2026. (9, Eurostat, 2026)
- Eurostat (2026). Cloud computing services by size class of enterprise. Online data code isoc_cicce_use, retrieved 7 November 2026. (10, Eurostat, 2026)
- European Commission, Directorate-General for Communications Networks, Content and Technology (2026). Digital Decade DESI dashboard: Digital Decade EU-level trajectories and Digital Economy and Society Indicators. (15, European Commission, 2026)