The Straight-Line Instinct: Curves That Bend
In December 2022 the European Parliament and the Council adopted a decision with a number in it. Decision (EU) 2022/2481 establishes the Digital Decade Policy Programme 2030, the Union's set of digital targets for the end of the decade. One of them is that by 2030 at least 75 per cent of enterprises in the Union have taken up cloud computing services, big data or artificial intelligence, in line with their business operations (Article 4(1), point (3)(a)) (43, European Union, 2022). An enterprise counts if it has taken up one or more of the three, so the Decision sets one target for the three together. The Commission's dashboard tracks a combined indicator for it, which stood at 63.2 per cent in 2025, and draws each technology separately beside it against the same 75 per cent (15, European Commission, 2026). For AI the dashboard's chart therefore has a single point at 2030: 75 per cent of enterprises with ten or more persons employed using at least one AI technology. That line is the Commission's chart of AI alone, not a separate target in the Decision.
Beside that point the dashboard draws the past. In 2021, the first year of Eurostat's table on AI use in enterprises, 7.65 per cent of enterprises in the EU with ten or more persons employed, outside the financial sector, said they used at least one AI technology. In 2023 the share was 8.06 per cent, in 2024 it was 13.48 per cent, and in 2025 it was 19.95 per cent (15, European Commission, 2026). Four points, five years, and a target far above them. Anyone who looks at the chart does what people do with a few points and a distant goal: they lay a ruler along the points and see where it lands.
The Commission does the same, openly, every year. The dashboard publishes a baseline trajectory, labelled "Baseline trajectory based on past perfomance" (sic), which is a line drawn forward from the observed points, and an ideal trajectory, labelled "DD trajectory (ideal path to reach the target)", the path the share would have to follow to reach 75 per cent in 2030. The dataset behind this chapter holds four of the baseline trajectories, computed in 2023, 2024, 2025 and 2026 (15, European Commission, 2026). They are the Commission's projections, not observations. The 2023 baseline, drawn when the only observation was the 2021 value, reached 20.29 per cent in 2030. The 2024 baseline, drawn after a second observation had barely moved, reached 16.76 per cent. The 2025 baseline, after one fast year, reached 35.92 per cent. The 2026 baseline, after two fast years, reaches 54.28 per cent. Four rulers, laid along the same series by the same office with the same method, pointing at four futures: each is what a straight line through the latest points says, and the latest points keep bending.
The questions
Question 3 asked: "Between 2021 and 2023, the share of EU enterprises using AI changed by how much?", with the options "It roughly doubled", "It rose by less than one percentage point" and "It fell". The measured answer is the second. The share was 7.65 per cent in 2021 and 8.06 per cent in 2023, a rise of 0.41 percentage points in two years (9, Eurostat, 2026). The first option is the one that the attention of those years pulls towards, since 2022 and 2023 were the years when AI was in every newspaper. Attention is not adoption: the survey asks whether an enterprise uses a technology, not whether its staff have heard of one.
Question 9 asked: "The Commission's Digital Decade dashboard sets 75 per cent as the 2030 target for the share of EU enterprises using AI. Following the trend as the 2023 edition of its baseline drew it, where would the share have reached in 2030?", with the options "About 20 per cent", "About 45 per cent" and "About 75 per cent". The measured answer is the first: the baseline trajectory the Commission computed in 2023 reached 20.29 per cent in 2030 (15, European Commission, 2026). That is the Commission's projection of that year, not an observation. The 2023 line put the share in 2025 at 12.35 per cent; the observed value was 19.95 per cent (15, European Commission, 2026). How far the 2026 line will miss is for later surveys to show. The two questions make the chapter's point: the first two points of this series pointed nowhere, and the last two point at the sky.
The instinct
Hans Rosling named a straight-line instinct in Factfulness, for the way people extend the world's population curve upwards as if it could not flatten (8, Rosling et al., 2018). The instinct in this chapter is a cousin, and the acknowledgement is due. It is the habit of taking the last two points of an adoption or capability curve, laying a ruler along them and reading the future off the ruler. It is a good habit almost everywhere else, since most things in daily life do continue for a while as they were going.
It misleads here because adoption and capability are not motion. They are the sum of many separate decisions, each made by a different organisation on a different day for a different reason, and the sum bends whenever the reasons change. A survey series of enterprise AI use rises when a product becomes cheap enough to switch on without a project or when the questionnaire adds a technology to its list; it stalls when the easy cases are used up or the first incidents make boards cautious; it jumps when a new kind of product fits an existing workflow. None of those events is visible in the two points before it. Extending the line is a statement that nothing will change, made while the reasons for the last change are still being worked out.
The instinct pulls in both directions. The slow line of 2021 to 2023 made the target look unreachable and adoption look stalled. The fast line of 2024 to 2025 makes the target look within reach and invites every board to ask why its own organisation is not on the line. Neither reading is supported by the points. What the points support is narrower: between those two surveys the share moved by so much, for reasons that can be investigated. A forecast would have to come from that investigation, not from the ruler.
The evidence
A target and four trajectories
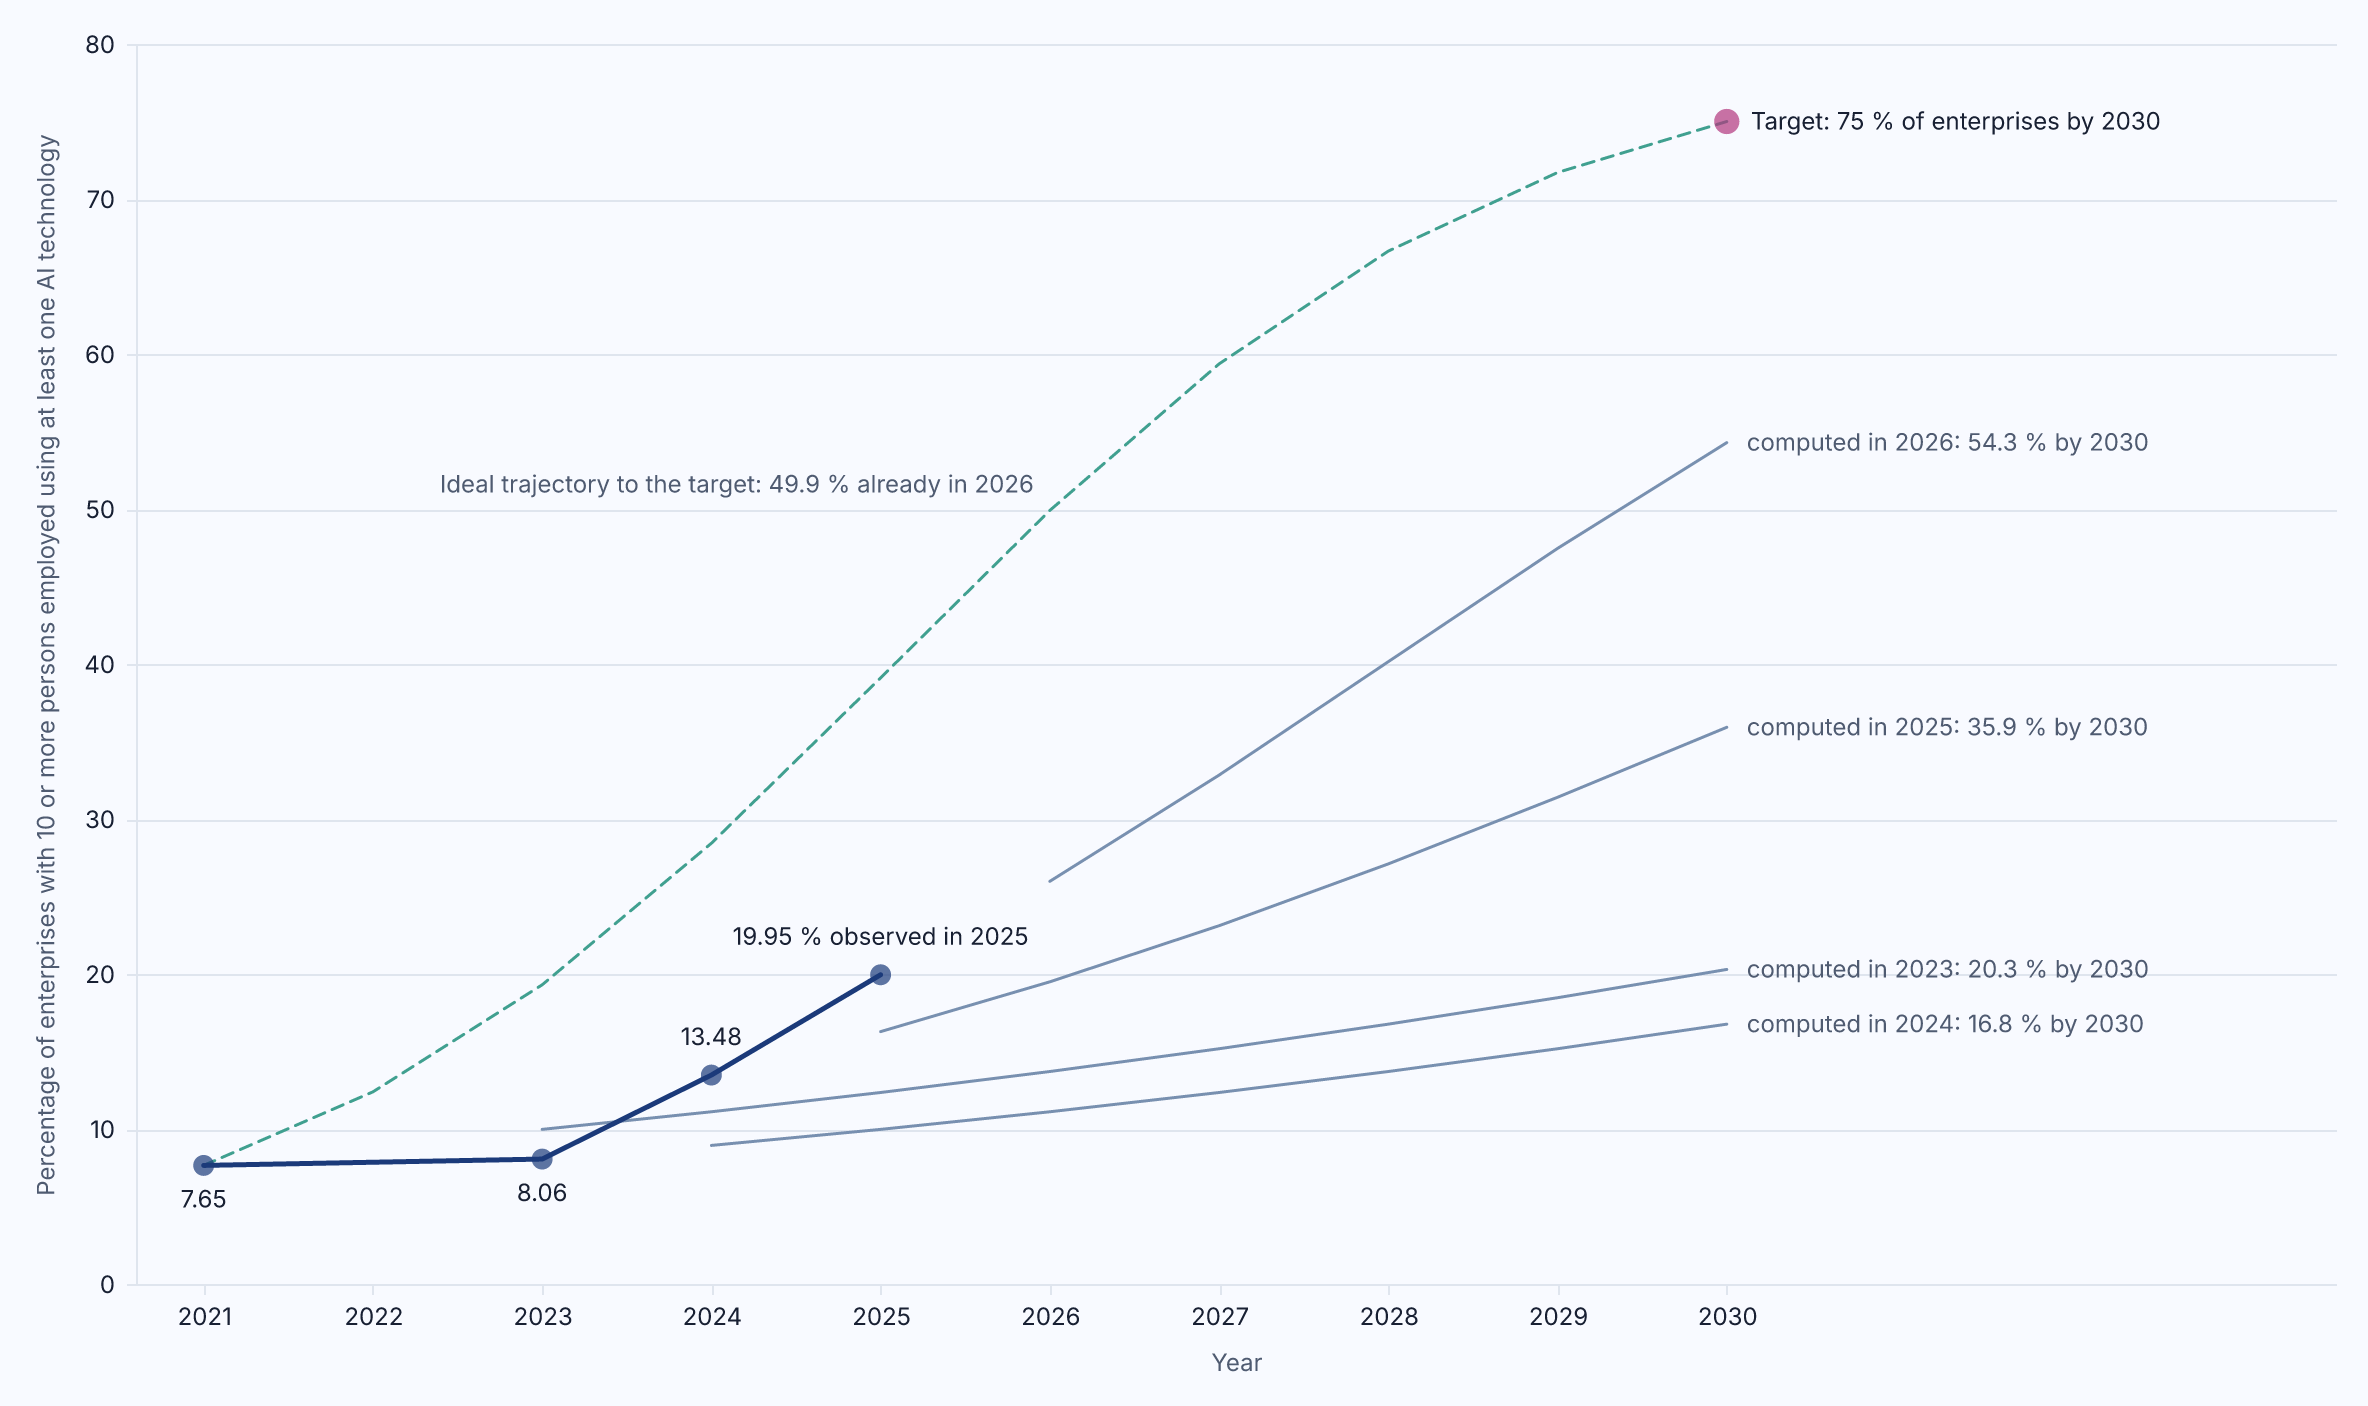
Figure 8.1: Four observations, one target, the ideal path to it and the four baseline trajectories the Commission computed from past performance in 2023, 2024, 2025 and 2026, each drawn from its year of computation and labelled with the value it projects for 2030; the trajectories are the publisher's projections, not observations. Source: European Commission, Digital Decade DESI dashboard, indicator dd_ai, based on Eurostat isoc_eb_ai (retrieved 2026).
Figure 8.1 is the chart the opening describes, each line labelled by the year it was drawn. The observed series is the filled line. The dashed line is the ideal trajectory of the 2026 vintage: it would have had the share at 39.11 per cent in 2025, when the observed value was 19.95, and asks for 49.91 per cent in 2026 (15, European Commission, 2026). The thin lines are the four baseline trajectories, ending at 20.29, 16.76, 35.92 and 54.28 per cent in 2030, and each was superseded within a year. The target itself is observable: it stands in an adopted instrument whatever the share does, although Article 4(2) of the Decision required the Commission to review the targets and their definitions by 30 June 2026 and allows it to propose amendments (43, European Union, 2022). The book makes no projection of its own before the marked section of Chapter 20.
Two features of the dataset matter before the next chart. The 2024 baseline lies below the 2023 one because the next observation, 8.0 per cent for 2023 as the Commission then had it (8.06 in the later vintages), stood only 0.4 points above the 7.6 per cent it had for 2021, where the first baseline had assumed about one point a year (my arithmetic on the dataset's values). And the 2025 observation rests on a longer list than the earlier ones: Eurostat's aggregate "at least one AI technology" now lists eight technology types, and the table reports one of them, AI that generates pictures, video or sound, used by 9.55 per cent of enterprises, only for 2025 (9, Eurostat, 2026). The table does not say how much of the jump from 13.48 to 19.95 per cent comes from the longer list and how much from wider use, and a line through 2024 and 2025 carries the whole step forward as if it would recur every year.
Size classes and countries
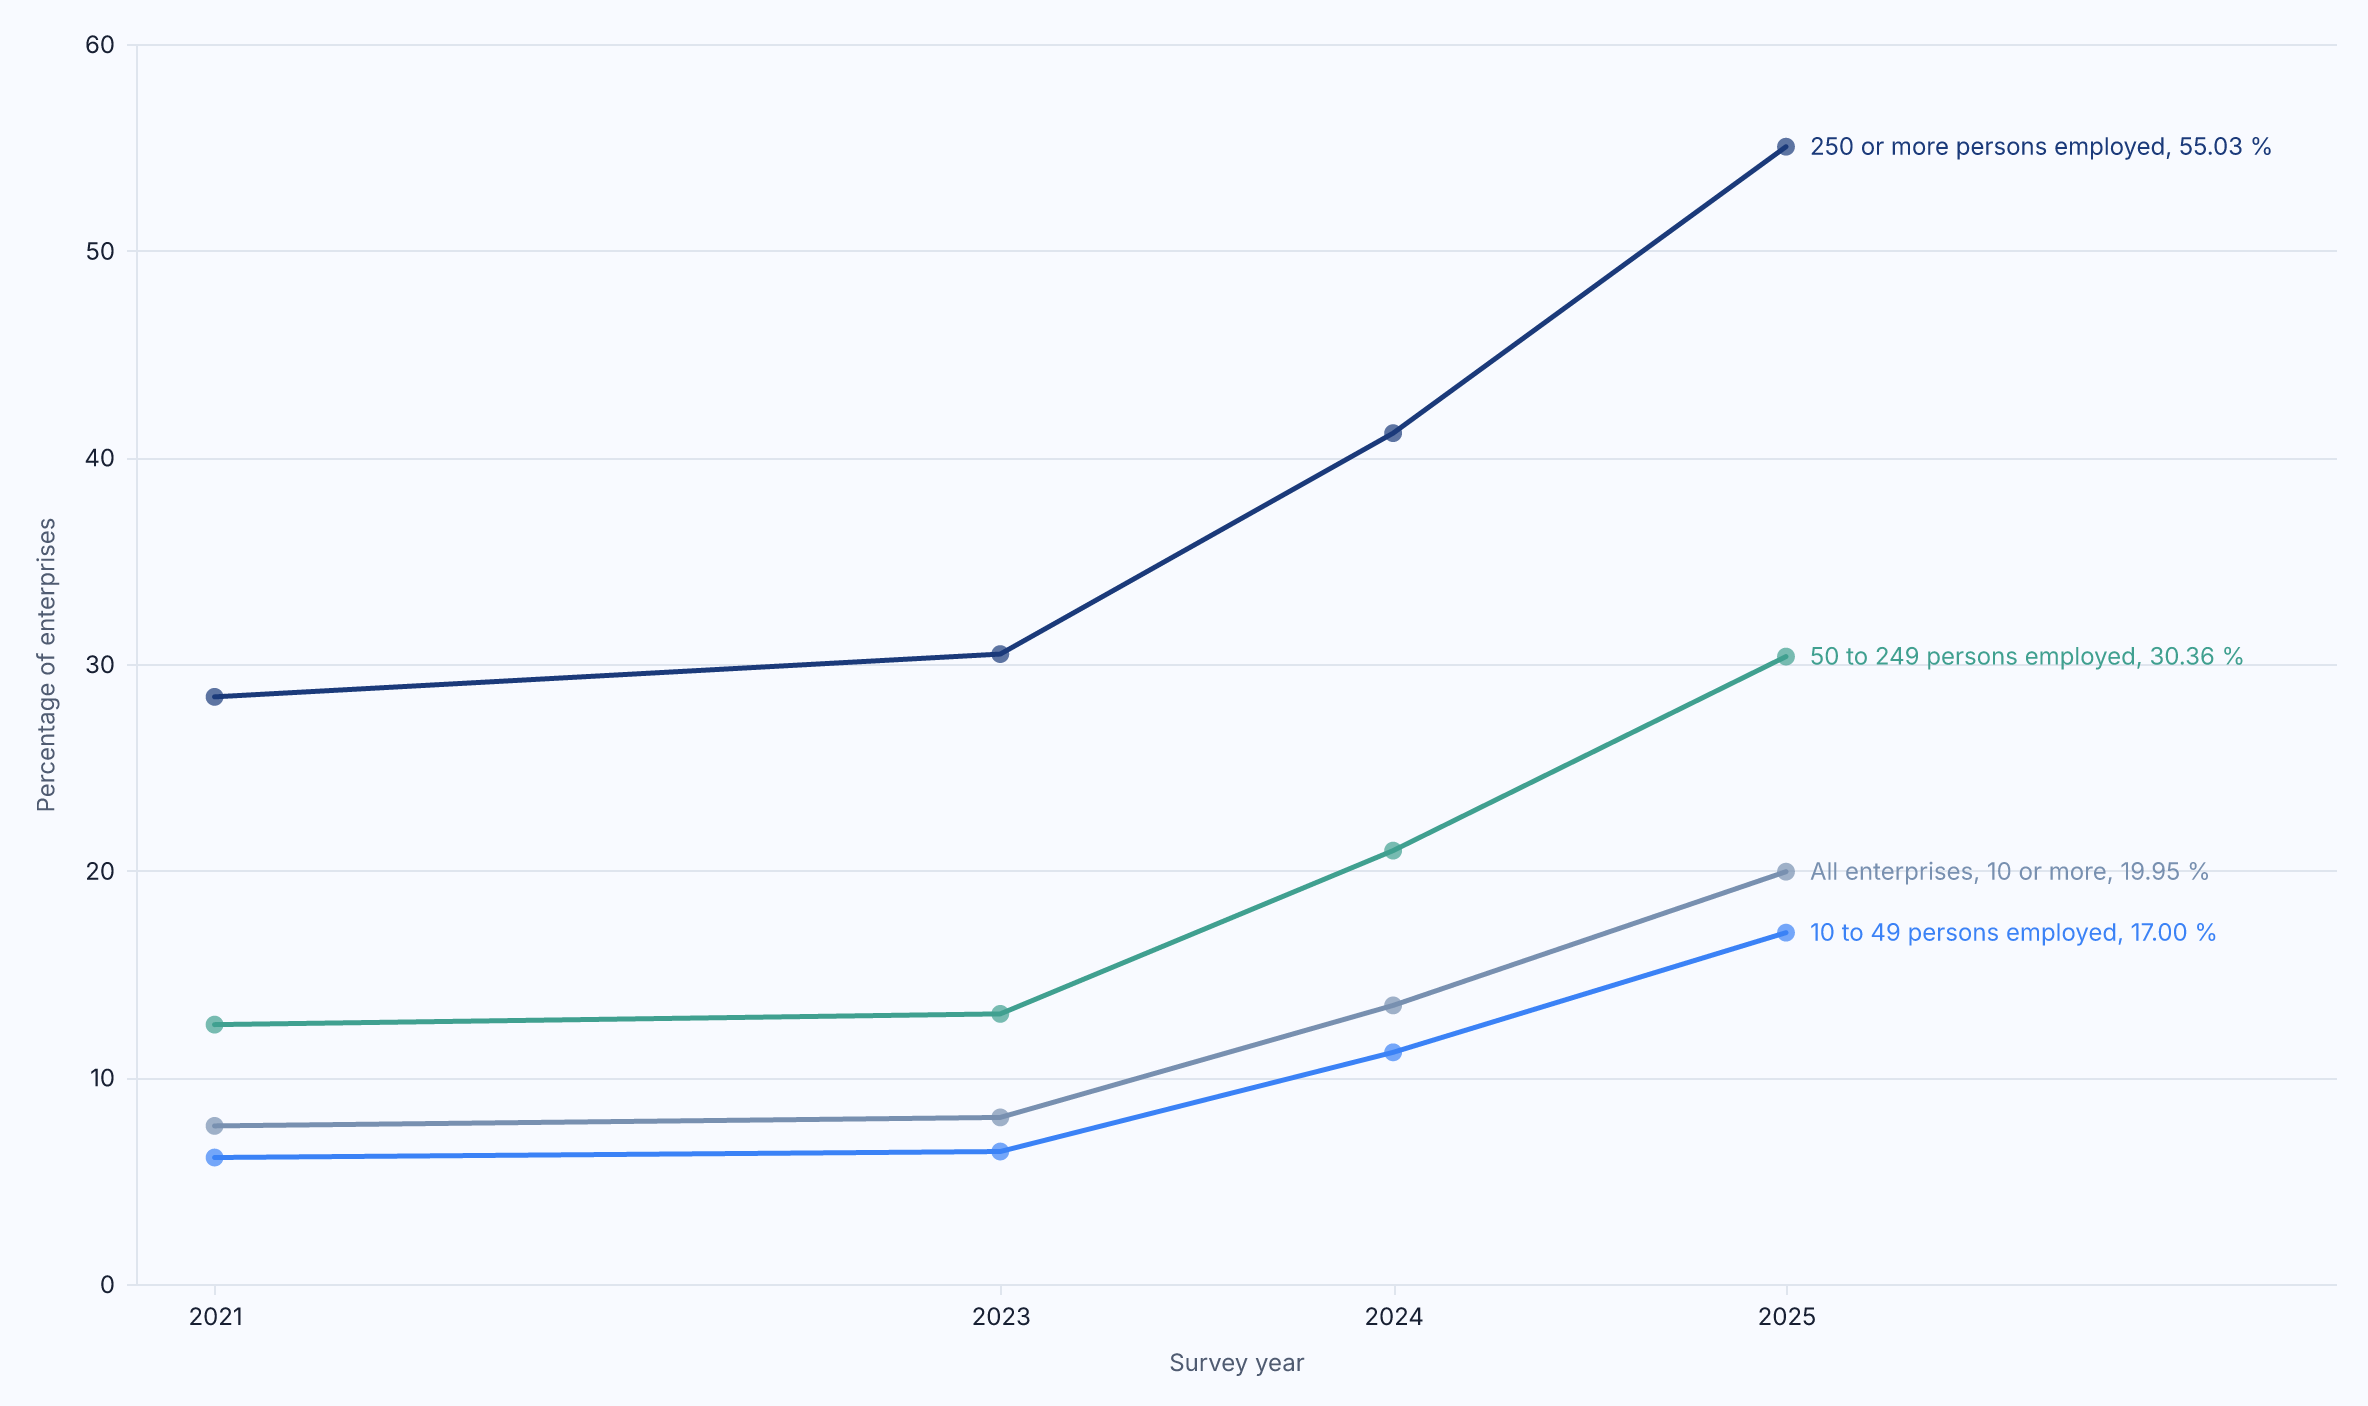
Figure 8.2: The share of EU enterprises using at least one AI technology rose in every size class between 2021 and 2025, at different heights and with the same bend; the 2025 aggregate includes an eighth technology type asked only from 2025. Source: Eurostat, isoc_eb_ai (retrieved 2026).
Figure 8.2 splits the EU series by size, measured in persons employed. Among enterprises with 250 or more persons employed, the share using at least one AI technology was 28.41 per cent in 2021, 30.48 per cent in 2023, 41.17 per cent in 2024 and 55.03 per cent in 2025. Among those with 50 to 249, it was 12.55, 13.07, 20.97 and 30.36 per cent. Among those with 10 to 49, which are most enterprises, it was 6.12, 6.41, 11.21 and 17.0 per cent (9, Eurostat, 2026). The shape is the same in each: two years of almost nothing, then two years of steep rise. The bend came in every size class in the same survey year, which points to a common cause, a new class of product, a changed questionnaire or both, rather than to thousands of independent decisions that happened to coincide.
The country series bend in more directions than the EU aggregate. In 2025 the share ran from 5.21 per cent in Romania and 8.36 per cent in Poland to 37.82 per cent in Finland and 42.03 per cent in Denmark. Denmark's own series is the clearest warning against the ruler: 23.89 per cent in 2021, 15.17 per cent in 2023, 27.58 per cent in 2024 and 42.03 per cent in 2025. A line through the first two Danish points fell; a line through the last two rises faster than anywhere in the Union. Eurostat flags breaks in the French and Swedish series in 2023 and in the Dutch series in 2025 (9, Eurostat, 2026), so whoever draws a trend through a country series has to read the flag column first: some of the bends are changes in the survey rather than in the country.
A curve that did bend: the cloud decade
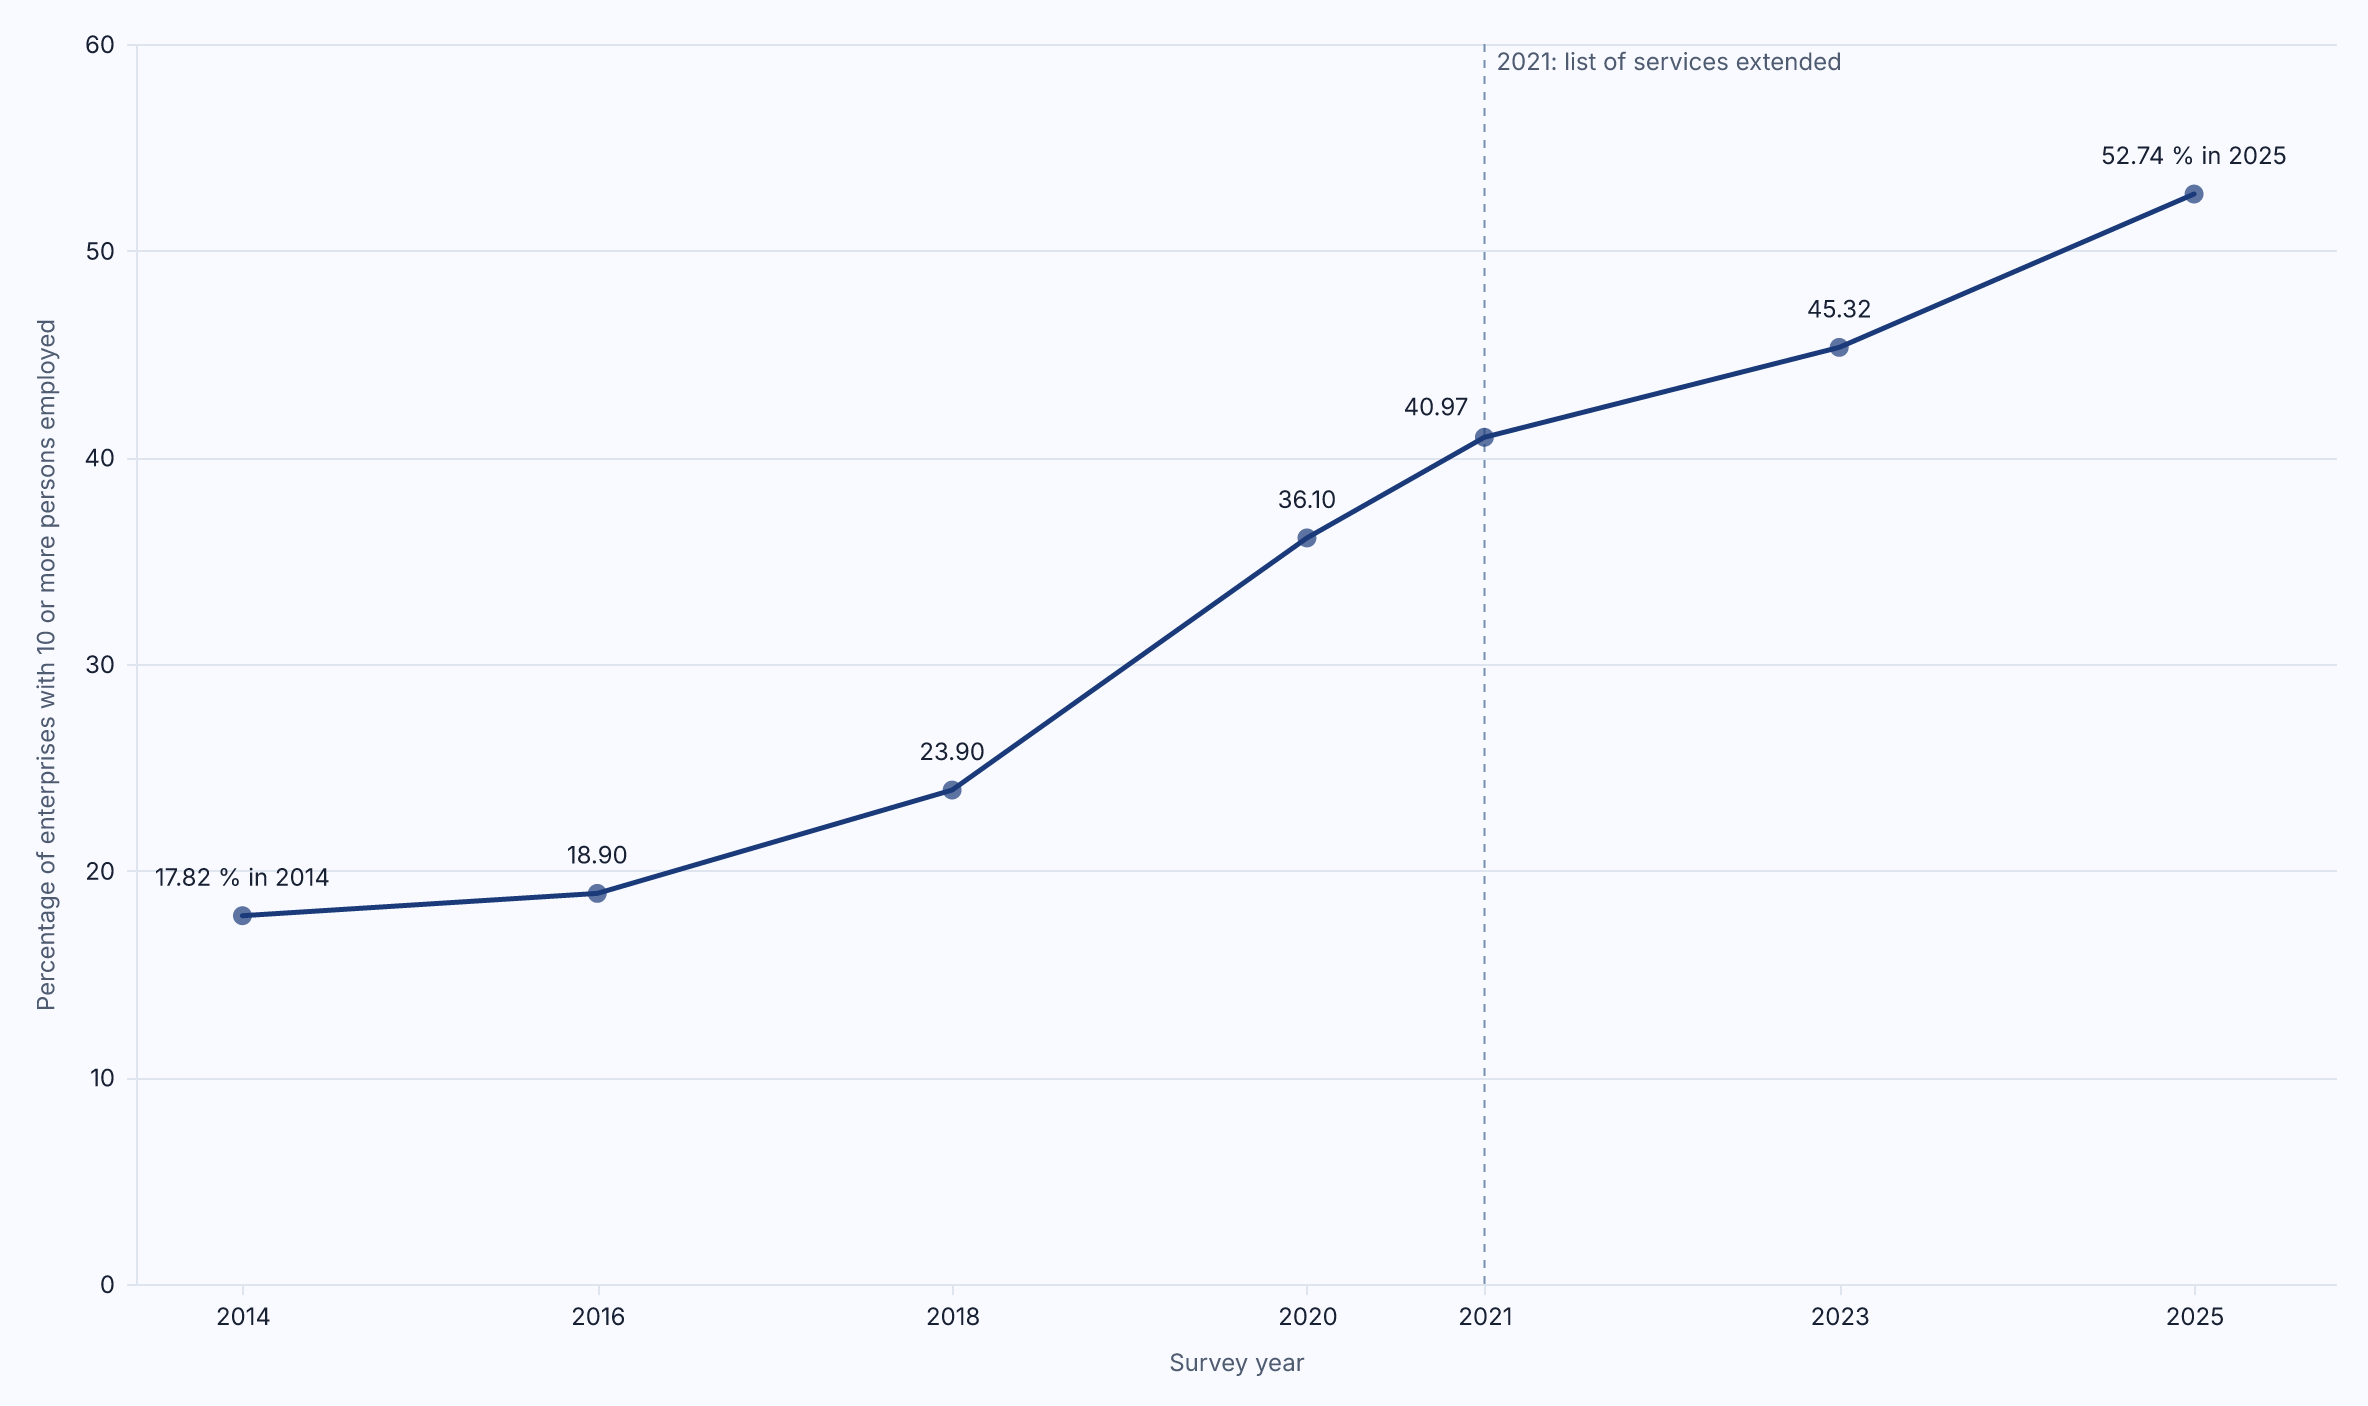
Figure 8.3: The share of EU enterprises with ten or more persons employed buying paid cloud computing services, in the survey years with an EU aggregate, 2014 to 2025; the list of services asked about was extended in 2021. Source: Eurostat, isoc_cicce_use (retrieved 2026).
The best evidence that adoption curves bend is an adoption curve that has had time to. Eurostat has asked enterprises about paid cloud computing services since 2014, and Figure 8.3 draws the headline series for the EU. The share was 17.82 per cent in 2014 and 18.9 per cent in 2016. It was 23.9 per cent in 2018 and 36.1 per cent in 2020, then 40.97 per cent in 2021, 45.32 per cent in 2023 and 52.74 per cent in 2025 (10, Eurostat, 2026). The list of services the question names was extended in 2021; the table carries no break flag on the EU headline for that year, and flags only Italy in 2016 and France and Sweden in 2023 (10, Eurostat, 2026).
Read the shape: flat for two years, then a steep stretch from 2016 to 2020 in which the share nearly doubled, then a slower climb. A ruler laid along 2014 and 2016 reaches about a quarter of enterprises in 2030; a ruler laid along 2018 and 2020 reaches nearly all of them by the same year. Both figures are my own arithmetic on two points each, and neither is a forecast. The series followed neither ruler, and the country that started highest plateaued: in Finland the share was 75.49 per cent in 2020, 75.29 per cent in 2021, 78.29 per cent in 2023 and 79.21 per cent in 2025 (10, Eurostat, 2026).
The Digital Decade tracks cloud against the same 75 per cent target on a narrower indicator, enterprises using at least one intermediate or sophisticated cloud service: 34.01 per cent in 2021, 38.97 per cent in 2023 and 46.69 per cent in 2025. The Commission's baseline trajectory for that indicator reached 66.47 per cent in 2030 when it was computed in 2023, 64.40 per cent in 2024 and 2025, and 60.57 per cent in 2026 (15, European Commission, 2026). Across the four vintages the Commission's projected 2030 value for cloud fell from 66.47 to 60.57 per cent, while the one for AI, after a dip in 2024, rose from 16.76 to 54.28 per cent, on the same dashboard and against the same target.
Capability curves
Adoption is one kind of curve. The other, the capability of the models themselves, is drawn more often and with more confidence. The Stanford AI Index 2025 reports Epoch AI's estimate that the training compute of notable AI models doubles roughly every five months, and the dataset kept for this book holds the compute figures behind that chart, from about 470 petaFLOP for a vision model released in 2012 to tens of billions of petaFLOP for multimodal models released in 2024 (17, Maslej et al., 2025). On a logarithmic axis that is a straight line, and three caveats keep it from being a forecast of anything an enterprise will experience. Compute is an input, not a capability. The set of "notable" models is chosen by the people who keep the database, so the line describes the frontier of what was built, not the models an organisation can buy or run. And benchmarks saturate: the Index notes that traditional benchmarks such as MMLU, GSM8K and HumanEval have saturated, and its example of one nearing saturation is a speech-recognition test whose best word error rate fell from 8.20 per cent in 2018 to 1.30 per cent in 2024, with the last step the smallest (17, Maslej et al., 2025). A line through the last two points of a benchmark near its floor would cross zero. What the curves mean for the next years is speculation on anyone's part; the compute line is observable up to the last model in the database and no further.
The picture corrected
The charts above have a year on the horizontal axis and a share on the vertical one, which is the picture the straight-line instinct lives in. The landscape of one organisation does not change along such an axis. In Contour, the notation of this book (Chapter 4), each AI use is a mark placed in a grid whose columns are the autonomy levels, Level 0 Advisory to Level 4 Autonomous, which say what the AI may do without a person approving each action, and whose rows are the reversibility tiers, R1 Reversible at once to R4 Irreversible, which say what it would take to undo what the use does. A mark's colour is its usage mode, which records how the organisation came to use the model, and its size is its reach, the number of people it touches in a year. Change in a landscape is a mark moving to a neighbouring cell, appearing or being retired. It is not a point sliding along a line.
The time frame of the notation draws that change as a trail: a hollow outline of the mark where it was at the first date, a thin line, and the filled mark where it is at the second, with a tick for a unit that appeared and a hollow mark with a cross for one retired. The view that uses it is V2, the landscape over time. I introduced it because none of the 284 diagrams in the seven volumes of the series shows a unit changing its level or its mode: time appears there as a gantt chart, as quarter boxes or as columns for the near and far future. Even the decay of reversibility within months of go-live, which AI Boss, Chapter 33, draws as a lesson from its illustrative year and labels "illustrated, not measured", is written only in prose (7, Nordqvist, 2026). V2 shows what moved, from where to where, and when.
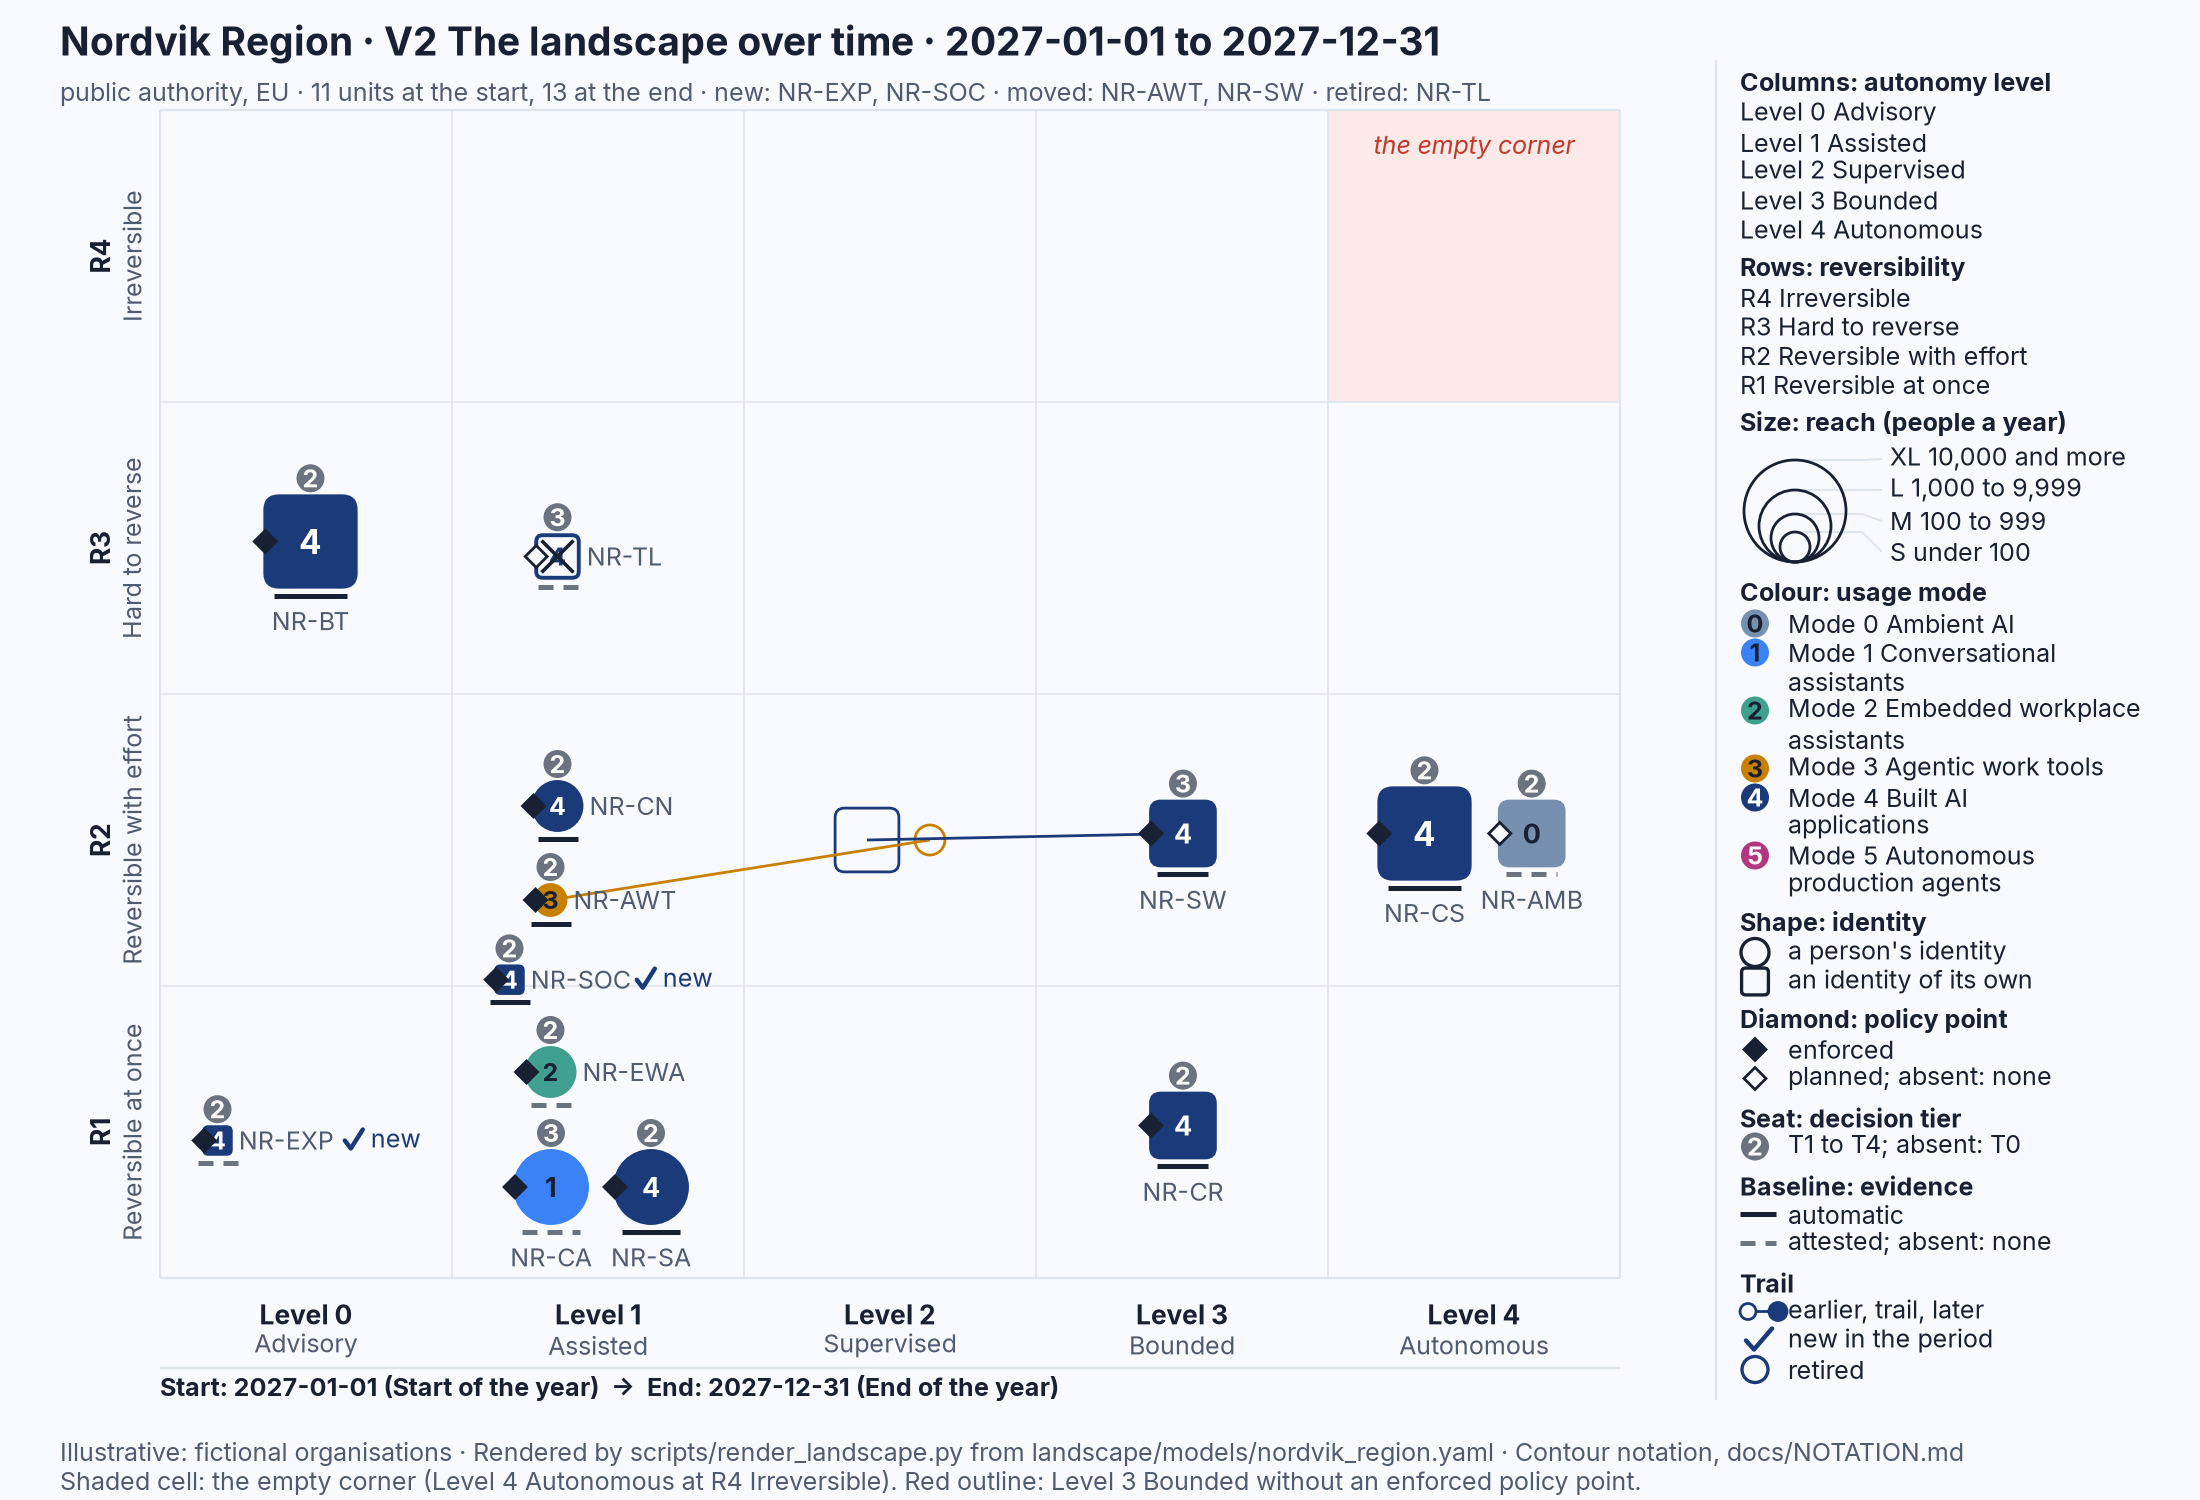
Figure 8.4: Nordvik Region's landscape from 1 January to 31 December 2027 in V2, the landscape over time, as the scenario of Chapter 18 draws it: two units move one column each, one is retired and two appear; no unit changes row and none moves along a line. Illustrative: rendered from landscape/models/nordvik_region.yaml.
Figure 8.4 is Nordvik Region's 2027. Nordvik Region is one of the two fictional organisations of this book, and the year is a scenario constructed from its landscape model, not a forecast and not data; Chapter 18 tells it in full. Read the figure with the rule from Chapter 4: the empty corner first, the shaded cell at Level 4 Autonomous and R4 Irreversible, which is empty at both dates. Then the trails. There are two. The agentic work tools of the platform team, the orange Mode 3 mark NR-AWT, move one column to the left, from Level 2 Supervised to Level 1 Assisted, when their mandate is aligned with the security architect's role charter. The rostering system NR-SW, a dark Mode 4 mark, moves one column to the right in the same row, from Level 2 Supervised to Level 3 Bounded, when its travel-time and rest rules are enforced as hard constraints and one class of action, offering an open shift to staff who have opted in, is allowed within the agreed profile. One unit is drawn hollow with a cross: the recruitment screening pilot NR-TL, paused in 2026 and not resumed. Two units carry the "new" tick: a SOC triage assistant and an exposure-prioritisation tool, both small, both in the bottom row.
Now count what the year does not do. Eleven units at the start, thirteen at the end. No unit changes row; nothing becomes harder to reverse. Two units change column, one in each direction, by one step each. A line through the Region's counts would say something about the number of units and nothing about any of this. The picture says which unit may now act within bounds, which was reined in, what was stopped and what was started, and that each is a dated decision by a named person at a seat, the small grey circle above a mark that carries the tier of whoever holds the decision right for it. That is how a landscape changes, cell by cell, and it is why a V2 answers the question a projection pretends to answer.
The rule of thumb
Rule of thumb: Never extend the last two points; ask what bent the last curve and what could bend this one.
The rule has two halves, and the second is the useful one. Asking what bent the last curve moves the conversation onto causes that can be checked: a product that became cheap enough to switch on, a questionnaire that added a technology, a regulation with a date, a plateau among the organisations that could switch easily. For the EU AI series the candidates are general-purpose assistants arriving inside products enterprises already licensed and, from 2025, a longer list of technologies in the survey, though the dataset does not give their weights. With those on the table, the question about the next bend takes the right form: which cause is still working, which has run its course, and what new one could appear.
The rule stops applying where the thing measured really is motion with a known mechanism: a data centre's power draw under a signed contract, the age of a workforce, the depreciation of equipment. It applies to adoption and capability because both are sums of decisions, and to any series with few points, and with extra force when the person drawing the line has a stake in where it lands.
What to do
For an executive
When a projection reaches the board, ask three questions before reading its end point: who computed it, from which points, and when it was last recomputed. A line with those three facts beside it is information; without them it is a drawing. The Commission's baseline trajectories pass the test, because the dashboard names the method, the points and the vintage, and their 2030 end point still moved from 16.76 to 54.28 per cent in two years (15, European Commission, 2026). Then ask for the organisation's own change in the form of Figure 8.4 rather than as a count: which units moved, in which direction, and who signed each move. Set the next review by the calendar and by trigger, not by the line. AI Governance, Chapter 22, concludes that the value of its register of trends lies in being wrong in a reviewable way, and a projection that is never recomputed cannot be (2, Nordqvist, 2026).
For an architect
Draw every projection with its year of computation on it, and draw the old ones beside the new one instead of deleting them. The chart behind Figure 8.1 does this: it reads the vintage from the name of each baseline series, draws each only from its own year of computation, and labels its end with the year and the projected value, so that the reader sees four rulers rather than one. The same discipline applies to the landscape model. Every change to a unit is a dated entry in its timeline with the decision that caused it, and the renderer draws the trail from those entries; nothing in V2 is interpolated. An architect who keeps the model this way answers the board's question about the next year with the decisions already taken and dated, which are observable in the model, and says of everything else that it is not in the model.
For a public official
Public targets attract straight lines because the target is a point and the present is a point, and the line between them looks like a plan. When a target of this kind is set or reported on, publish the trajectory the way the Commission does: the observed points with their source and flags, the ideal path, the baseline trajectory with its method and its year of computation, and last year's beside it. In your own authority, record the state of each AI use on two dates a year in the form of Figure 8.4 and publish the changes with the decision that caused each, so that a citizen, a journalist or an auditor can see that a unit moved because an official decided it should, not because a line said it would.
Nordvik Region and Hansa Mutual
Both organisations are illustrative, and everything here is rendered from their landscape models or taken from their profiles. In the scenario of Chapter 18, Nordvik Region's 2027 is Figure 8.4: two decisions to move a unit one column, one in each direction, one decision not to resume a paused pilot, and two small additions in the bottom row, each dated and signed at a seat of tier T2 or T3.
Hansa Mutual's V2 for the same scenario year has no trail in it at all: seventeen units at the start and seventeen at the end, none moved, none new, none retired. Its changes are in the seats, and Chapter 18 tells them: in the scenario, the executive board takes the decision right over every agent with write access to production on 31 March, after the first stop drill of the IT-operations agent takes 17 minutes against a budget of 5. A count of agents would show nothing for the year; the seats show what changed.
Summary
The chapter opened with a point and four rulers. Decision (EU) 2022/2481 sets a target of 75 per cent of enterprises using cloud, big data or AI by 2030, and the Commission's dashboard tracks a combined indicator and each technology, AI included, against that figure and recomputes a baseline trajectory every year. The observed share of EU enterprises using at least one AI technology was 7.65 per cent in 2021, 8.06 in 2023, 13.48 in 2024 and 19.95 in 2025; the baseline trajectories drawn through those points reached 20.29, 16.76, 35.92 and 54.28 per cent in 2030 when computed in 2023, 2024, 2025 and 2026. Each was the Commission's projection and each was superseded within a year. Question 3 and Question 9 rest on the first two points and on the first ruler.
The straight-line instinct is the habit of extending the last two points. It serves well for motion and badly for adoption and capability, which are sums of separate decisions and bend whenever the reasons change. The evidence showed the bend in every size class in the same survey year, in country series that fell and then jumped, in a cloud series that went flat, then steep, then slower over a decade, and in the Commission's cloud projection falling across the vintages while its AI projection, after a dip, rose. Capability curves bend too, where benchmarks saturate.
The picture corrected is V2, the landscape over time, in which change is a trail from one cell to a neighbouring one, a tick for a unit that appeared or a cross for one retired. Nordvik Region's scenario year has two moves of one column each, one retirement and two additions, and no change of row. The rule of thumb follows: never extend the last two points; ask what bent the last curve and what could bend this one. The executive asks who computed a projection, from which points and when; the architect draws every projection with its year of computation and keeps changes as dated entries; the public official publishes the trajectory with its vintages and the changes with their decisions.
The straight-line instinct makes a smooth future out of steps. The next instinct concerns which harms get discussed at all. Chapter 9 turns to the fear instinct and to what the surveys and the incident record each measure.
Sources
- European Parliament and Council of the European Union (2022). Decision (EU) 2022/2481 of 14 December 2022 establishing the Digital Decade Policy Programme 2030. Official Journal of the European Union, L 323. (43, European Union, 2022)
- European Commission, Directorate-General for Communications Networks, Content and Technology (2026). Digital Decade DESI dashboard: Digital Decade EU-level trajectories and Digital Economy and Society Indicators. digital-decade-desi.digital-strategy.ec.europa.eu. (15, European Commission, 2026)
- Eurostat (2026). Artificial intelligence by size class of enterprise. Online data code isoc_eb_ai. (9, Eurostat, 2026)
- Eurostat (2026). Cloud computing services by size class of enterprise. Online data code isoc_cicce_use. (10, Eurostat, 2026)
- Maslej, N., Fattorini, L., Perrault, R. et al. (2025). The AI Index 2025 Annual Report. AI Index Steering Committee, Institute for Human-Centered AI, Stanford University. (17, Maslej et al., 2025)
- Rosling, H., Rosling, O. and Rosling Rönnlund, A. (2018). Factfulness: Ten Reasons We're Wrong About the World – and Why Things Are Better Than You Think. London: Sceptre. (8, Rosling et al., 2018)
- Nordqvist, G. (2026). AI Governance: Governing Artificial Intelligence in European Enterprises and Public Authorities. aig.geon.se. (2, Nordqvist, 2026)
- Nordqvist, G. (2026). AI Boss: When Artificial Intelligence Manages People in European Enterprises and Public Authorities. aiboss.geon.se. (7, Nordqvist, 2026)