The Fear Instinct: The Loud Harms and the Quiet Ones
Between 25 April and 22 May 2024, interviewers working on behalf of the European Commission interviewed 26,415 residents of the 27 member states, aged 15 and over, face to face in their homes or, in five countries, by video. They read a preamble about AI being used in workplaces to monitor and evaluate workers or assign them tasks, and asked. To the statement "Robots and Artificial Intelligence are technologies that require careful management", 84 per cent of respondents answered that they agreed. To "Due to the use of robots and artificial intelligence, more jobs will disappear than new jobs will be created", 66 per cent agreed. Asked how they perceived the use of these technologies for "Automatically firing workers", 78 per cent answered negatively, and for "Monitoring workers", 63 per cent did (29, European Commission, 2025). The same respondents were not against the technology: 62 per cent perceived the use of robots and AI in the workplace positively (29, European Commission, 2025). People can welcome a tool and fear what it might be used for in the same breath.
The pattern repeats wherever it has been measured. In August 2024 the Pew Research Center asked a probability panel of 5,410 adults in the United States whether the increased use of AI in daily life made them feel more excited than concerned, more concerned than excited, or equally both; 51 per cent answered more concerned than excited, against 15 per cent of 1,013 people who had written or presented at AI conferences (32, McClain et al., 2025). In the nine EU member states Pew surveyed in spring 2025 the share more concerned than excited ran from 29 per cent in Germany to 50 per cent in Italy (33, Poushter et al., 2025). Ipsos, a market research company, found in March and April 2025, as an unweighted average of its 30 country results in a vendor survey, 53 per cent agreeing that products and services using AI made them nervous and 52 per cent that they made them excited (31, Ipsos, 2025).
Now set those answers beside the records of harm. In Eurostat's 2024 survey, 21.54 per cent of EU enterprises with ten or more persons employed reported an ICT security incident of the kind Question 7 describes below, and most of them were failures, not attacks. In the AI Incident Database the largest group of classified incidents is people using AI against other people, and the subdomain closest to the machine that escapes holds three records (35, Responsible AI Collaborative, 2026). The stories that travel and the harms the records contain are not the same list, and this chapter is about that gap.
The questions
Question 7 asked: "In the 2024 survey, what share of EU enterprises reported an ICT security incident that made services unavailable, destroyed data or disclosed confidential data?", with the options "About 5 per cent", "About 12 per cent" and "About 20 per cent". The measured answer is the third: 21.54 per cent of enterprises in the EU with ten or more persons employed reported at least one such incident, a little below the 22.16 per cent of the 2022 survey (11, Eurostat, 2026). Eurostat's questionnaire asks about incidents experienced in the calendar year before the survey, so the 2024 survey describes 2023 (11, Eurostat, 2026). The survey excludes the financial sector. A base rate of one enterprise in five is the figure to hold beside any single incident story.
Question 11 asked which kind of harm is the most frequent among the classified incidents in the AI Incident Database. Its home is Chapter 7, and the one number this chapter needs is that 566 of 1,498 classified incidents fall in the domain "Malicious actors and misuse", while the subdomain "AI pursuing its own goals in conflict with human goals or values" holds 3 (35, Responsible AI Collaborative, 2026).
The instinct
Hans Rosling named a fear instinct in Factfulness: the attention we give to what frightens us, out of proportion to its frequency, because fear once kept us alive (8, Rosling et al., 2018). The instinct in this chapter is the same one at work on a new subject, and the acknowledgement is due. Among everything that could be told about AI at work, the stories that spread have a frightening shape: the machine that acts on its own, the attacker who gets in, the decision made about a person by nobody. They have an agent and a victim, and a century of fiction behind them that AI Threat, Chapter 2, surveys (5, Nordqvist, 2026). The warnings were not foolish, and neither is the instinct that attends to them.
It is useful where the hazard is real, immediate and rare, which is where fear evolved. When an agent with write access to production is about to be switched on, the board member who asks what happens if it misbehaves is doing what the instinct is for. It misleads when it runs ahead of the record and sets the agenda for everything else. A rogue agent is a story; a scam that uses a cloned voice to take an elderly person's savings is a case file; a server that fails and leaves a benefits office without its case system for a day is counted only in a survey.
The claim of this chapter is narrower than "people fear the wrong things", and the evidence does not support that wider claim. Where respondents were asked what concerns them about AI at work, the concerns they named most were quiet ones: jobs, monitoring and automated dismissal. What the chapter claims concerns the agenda. Stories select which harm a board, a council or a newsroom discusses first, and the records show that the harms with the highest counts are not the harms of the most frightening stories. The second half is a count. The first half, that stories select, is the description of the instinct, illustrated in the two organisations below; no survey cited here measures what boards discuss.
Author's note needed: a short passage, half a page at most, from the author's practice: a steering group or board where a news story about an agent acting on its own displaced, on the agenda, the quarter's report on service outages and fraud losses; what the figures in that report were, and how the discussion was brought back to them. It belongs here, before the evidence.
The evidence
What people say they fear
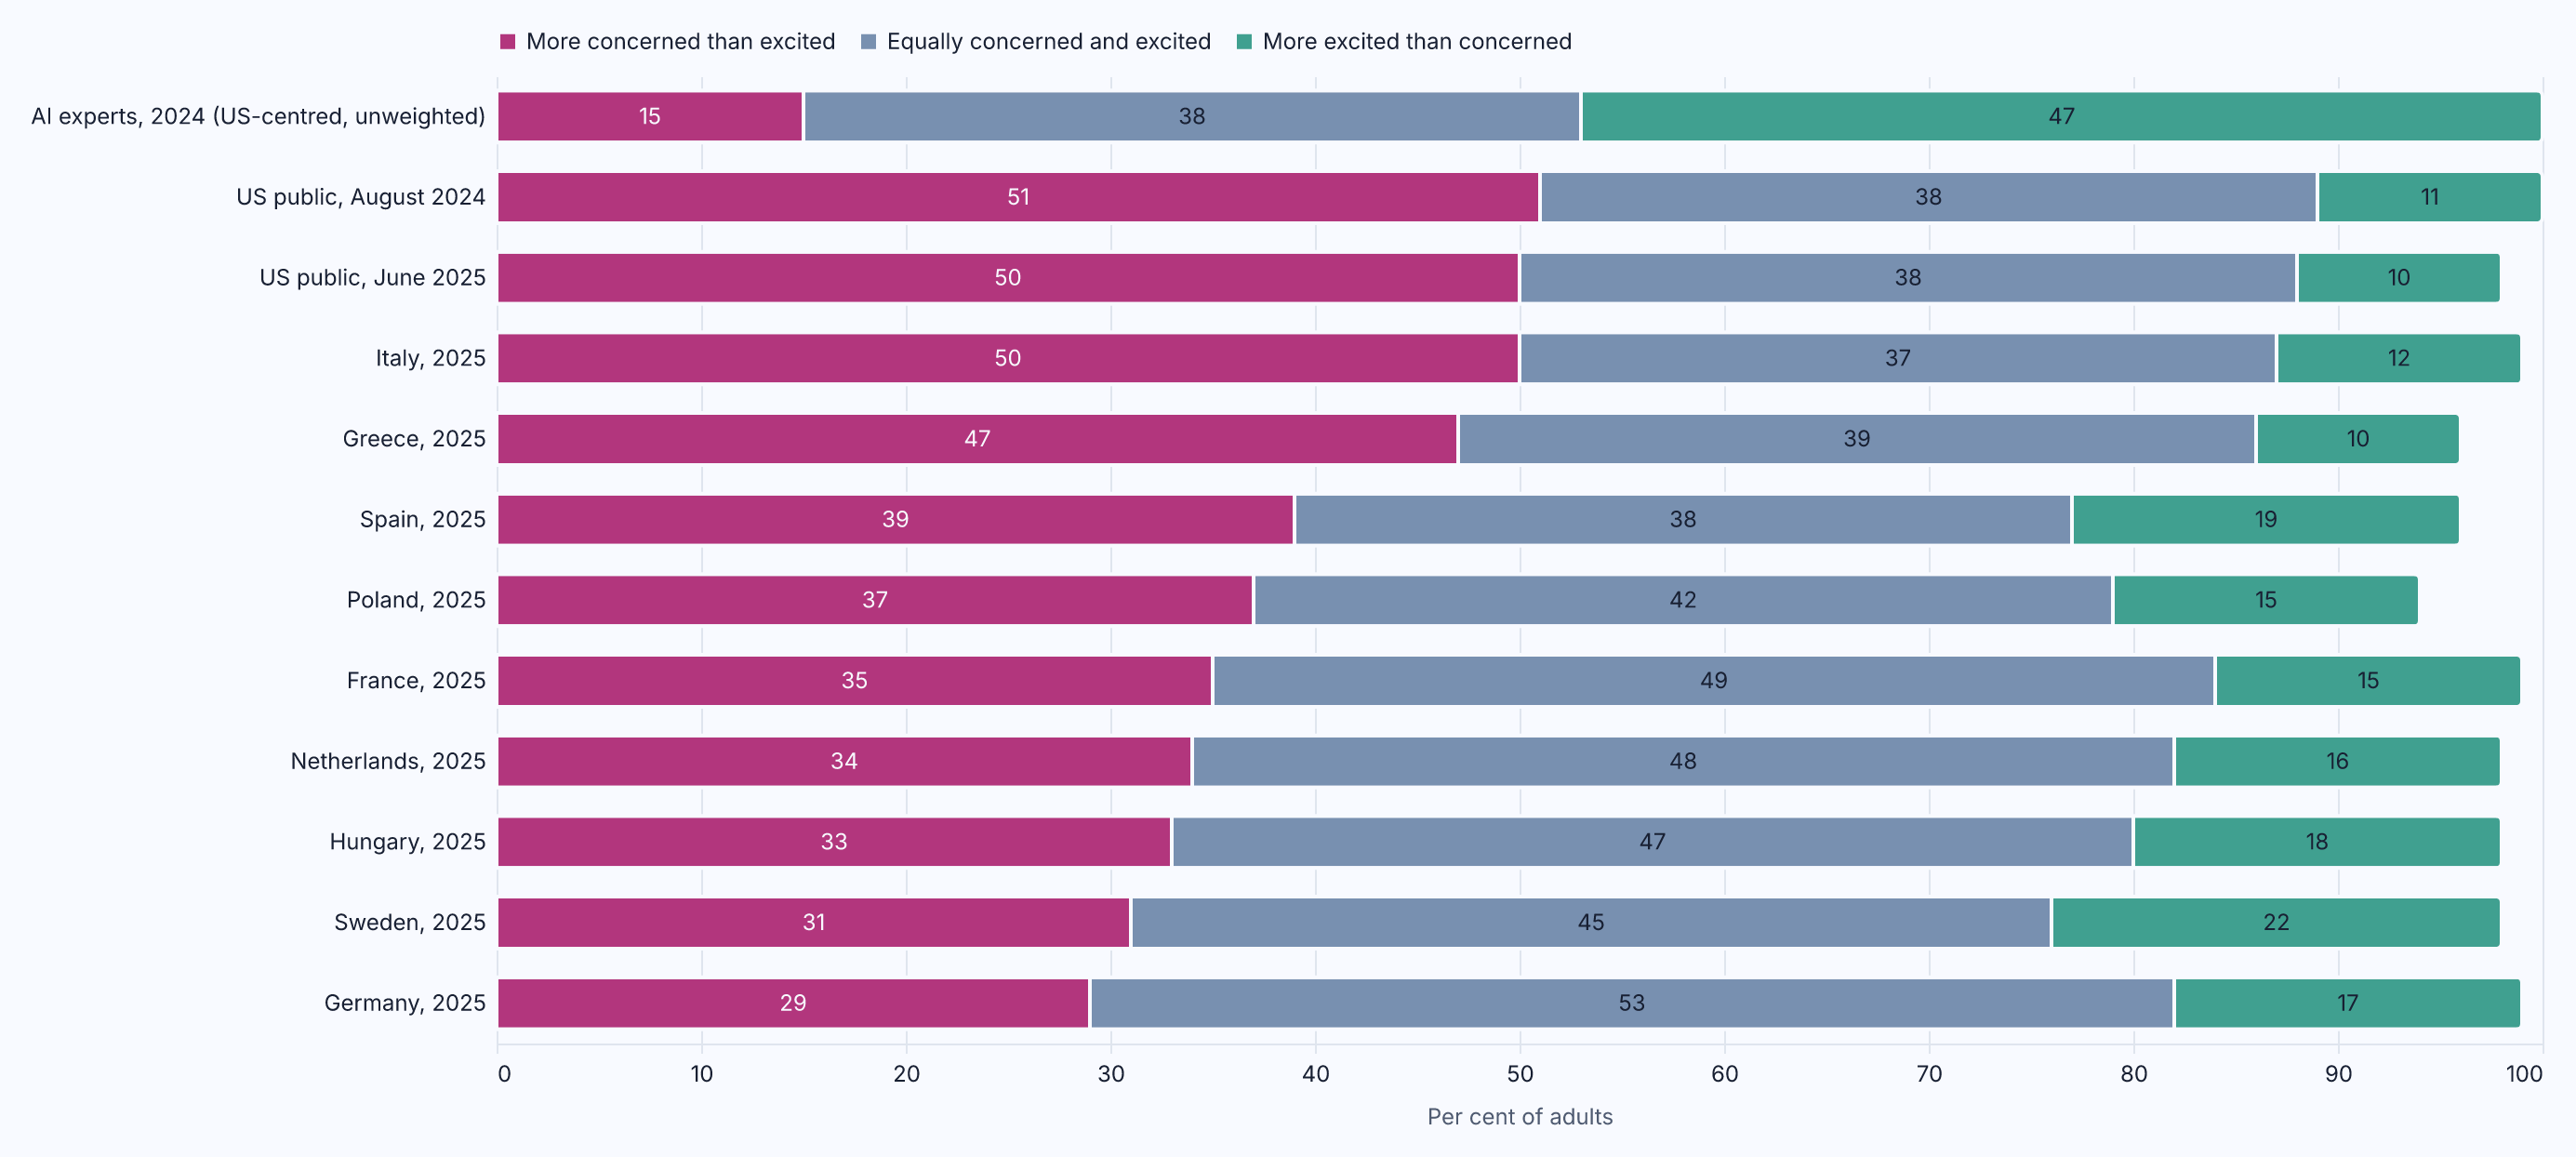
Figure 9.1: How the increased use of AI in daily life makes people feel, for AI experts surveyed by Pew in 2024 (a convenience sample of conference authors, unweighted), the US public in August 2024 and June 2025, and nine EU member states in spring 2025, sorted by the share more concerned than excited; don't-know shares of 1 to 6 per cent are not drawn. Source: Pew Research Center, How the U.S. Public and AI Experts View Artificial Intelligence (2025) and How People Around the World View AI (2025) (retrieved 2026).
Figure 9.1 lines up every population that has been asked Pew's question. The experts are at the top: 15 per cent more concerned than excited, 47 per cent more excited, 38 per cent equally both; Pew warns that this sample of conference authors is unweighted and not representative of all AI experts (32, McClain et al., 2025). The US public answered 51 per cent more concerned, 11 more excited and 38 equally both in August 2024 (32, McClain et al., 2025), and 50, 10 and 38 per cent in June 2025 (33, Poushter et al., 2025). Italy, 50 per cent more concerned, and Greece, 47, sit near the US figure; the other seven countries, from Spain at 39 to Germany at 29, sit well below it (33, Poushter et al., 2025). The European picture is divided feeling, with "equally concerned and excited" the largest answer in six of the nine countries.
Where a survey has asked what people are concerned about, the answers are specific. In the Eurobarometer the activities perceived most negatively were automatically firing workers, 78 per cent, monitoring workers, 63, selecting applicants for a job and assessing workers' performance, 57 each, and collecting, processing and storing workers' personal data, 49 (29, European Commission, 2025). Dismissal, surveillance, selection, scoring, personal data: these are quiet harms, and they are the leading concerns in the statements quoted. The survey does not show respondents fearing the wrong things; none of the questions quoted concerns a machine escaping control.
Failures and attacks
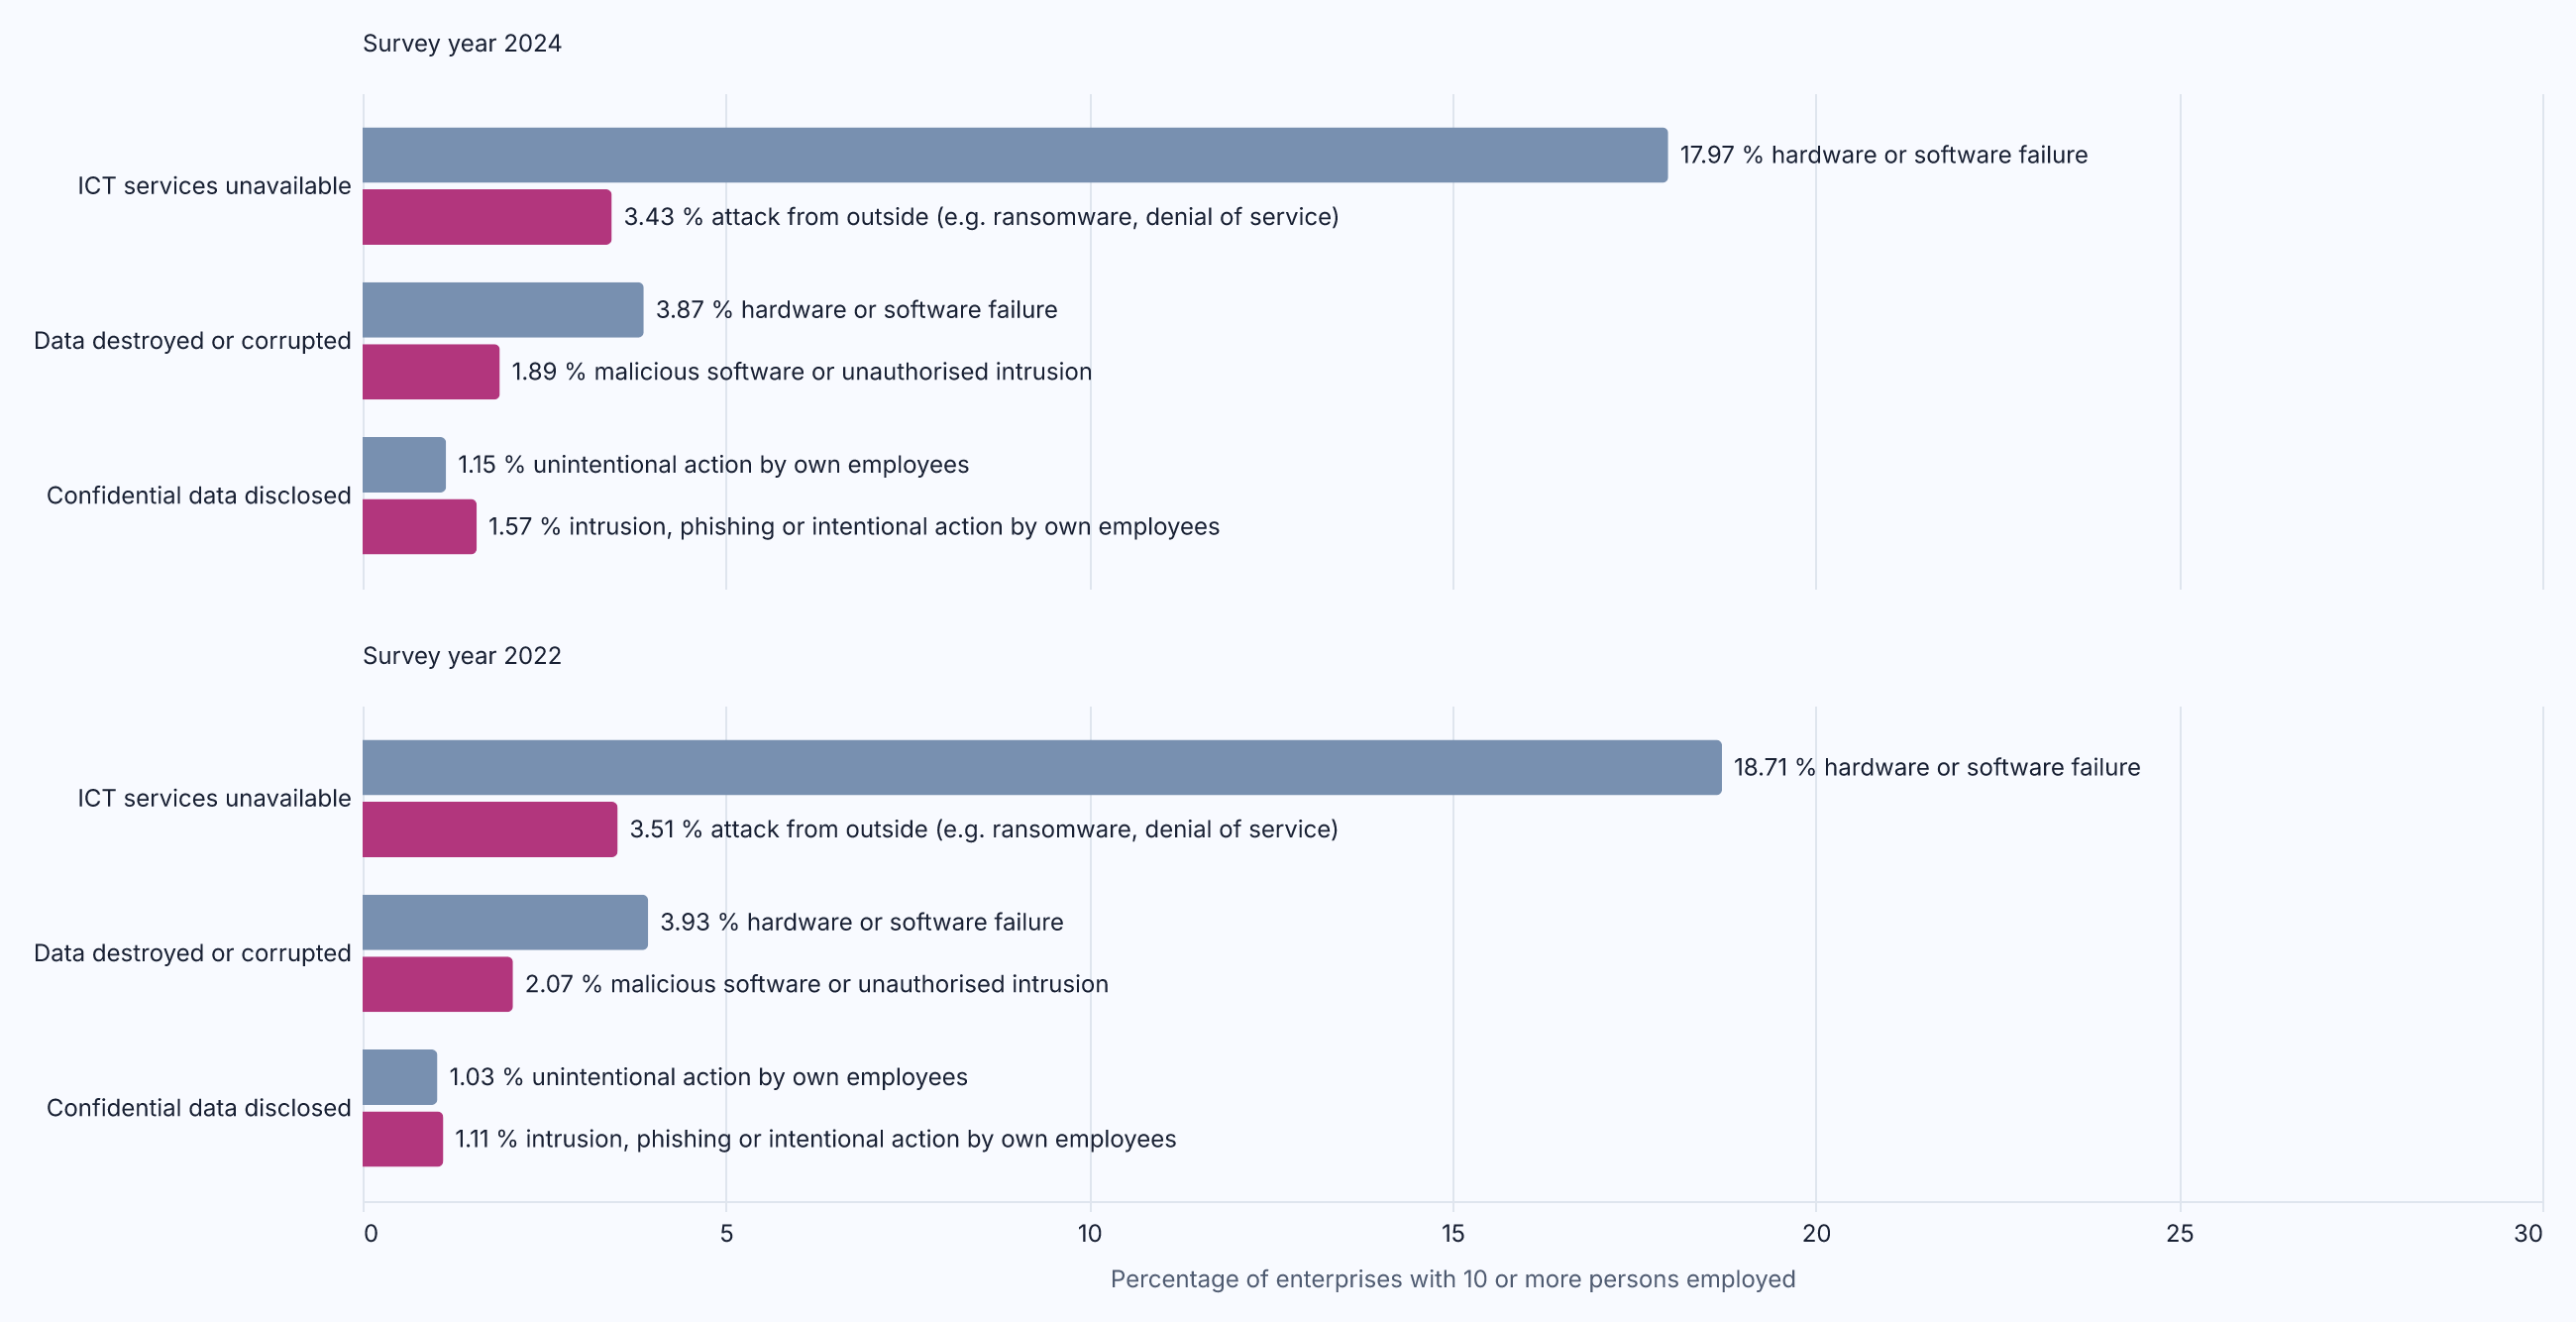
Figure 9.2: The share of EU enterprises with ten or more persons employed that experienced ICT security incidents in the 2024 survey (upper panel) and the 2022 survey (lower panel), by consequence and by cause: failures and mistakes outnumber attacks and malicious acts for unavailable services and destroyed data, and the order reverses for disclosed data; the questionnaire asks about the calendar year before the survey. Source: Eurostat, isoc_cisce_ic (retrieved 2026).
Figure 9.2 is the record behind Question 7, drawn as pairs. In the 2024 survey, services were unavailable because of hardware or software failure at 17.97 per cent of enterprises and because of an attack from outside, the questionnaire's examples being ransomware and denial of service, at 3.43 per cent. Data were destroyed or corrupted by failure at 3.87 per cent and by malicious software or intrusion at 1.89. Confidential data were disclosed through unintentional actions by the enterprise's own employees at 1.15 per cent and through intrusion, phishing or intentional actions at 1.57 (11, Eurostat, 2026). The 2022 survey shows the same shape: 18.71 against 3.51, 3.93 against 2.07, 1.03 against 1.11. Disclosure is the one consequence where the malicious cause edges ahead, and the rarest. For a service that stops, the quiet cause outnumbers the loud one by about five to one in both surveys. None of this refutes the instinct, since 3.43 per cent of enterprises is a great many enterprises; the record says what else happened, more often, in the same year.
What the threat landscape consists of
ENISA's annual threat landscape is the public record of what attackers in Europe did, assembled mainly from open sources with anonymised information from member states. The 2025 edition, for July 2024 to June 2025, analysed 4,875 incidents: about 76.7 per cent were distributed denial-of-service attacks and 17.8 per cent were intrusions, and of the intrusions whose vector was observed, about 60 per cent began with phishing. Where a sector could be assigned, and 28.5 per cent of incidents had none, public administration was the most targeted, with 38.2 per cent of sector-attributed incidents, and 96.2 per cent of that picture was hacktivist-led denial of service (38, ENISA, 2025). ENISA itself warned, in the 2024 edition, that "an increase in reported cyber-attacks doesn't necessarily indicate an actual rise in the number or severity of attacks" (37, ENISA, 2024). A record that is three quarters denial of service claimed by hacktivists is a record of noise as much as of damage.
On AI, the 2025 report wrote that, although "publicly available evidence suggests that misuse of LLMs and other AI tools occurs more frequently than direct efforts to compromise AI systems", researchers had identified proofs of concept for subverting AI models; it relays a vendor's figure that over 80 per cent of phishing emails identified between September 2024 and February 2025 used AI to some extent (38, ENISA, 2025). AI appears in the European threat record mainly as a tool in the hands of people doing what people already did, which is observable, in the agency's words, for the year the report covers.
Which harms recur
The AI Incident Database was founded so that repeated real-world AI failures could be prevented by cataloguing the ones that had happened (50, McGregor, 2021). It is curated from press reports and public submissions by volunteer editors, so it records what was reported, mainly in English-language media, not what happened; European incidents are under-represented, and a year's count keeps rising as reports are added (35, Responsible AI Collaborative, 2026). With those limits stated, the snapshot holds 179 incidents dated 2023, 313 dated 2024, 463 dated 2025 and 296 in the first ten months of 2026. That the count has risen each year is observable; how much is harm and how much is attention, the database cannot say. The Dutch childcare benefits affair, in which a benefits system wrongly accused families of tax fraud, is among the records (35, Responsible AI Collaborative, 2026).
Within the 566 incidents of misuse, fraud, scams and targeted manipulation account for 412. Below them the subdomains run: lack of capability or robustness, 306; false or misleading information, 192; disinformation, surveillance and influence at scale, 138; unfair discrimination and misrepresentation, 118. Then the tail the fear instinct lives in: AI system security vulnerabilities and attacks, 24; cyberattacks, weapon development or use and mass harm, 15; AI pursuing its own goals, 3. The classifiers recorded 736 incidents as intentional, 741 as unintentional and 21 as neither (35, Responsible AI Collaborative, 2026), so about half involved someone's purpose and not only a system's failure.
AI Threat, Chapter 4, offers a way to hold these numbers against the stories: an evidence ladder with five rungs, fiction, argument, laboratory demonstration, incident in the wild and pattern at scale, on which a claim is graded at the highest rung its evidence reaches (5, Nordqvist, 2026). Fraud and discrimination by means of AI are patterns at scale. Agents acting beyond their mandate are, by that book's account, incidents in the wild, and developers have answered by moving controls out of the agent and into its environment (5, Nordqvist, 2026). Whether such incidents will grow in number as more agents are given write access is speculation: the mechanism makes it plausible, but this book holds no count of agents with write access to set against it. A system escaping control altogether has not left the rungs of argument and laboratory demonstration, and the claim that it will is speculation, as AI Threat labels it. The ladder says where each claim stands today, not that the top rungs are empty for ever.
Fear beside the record
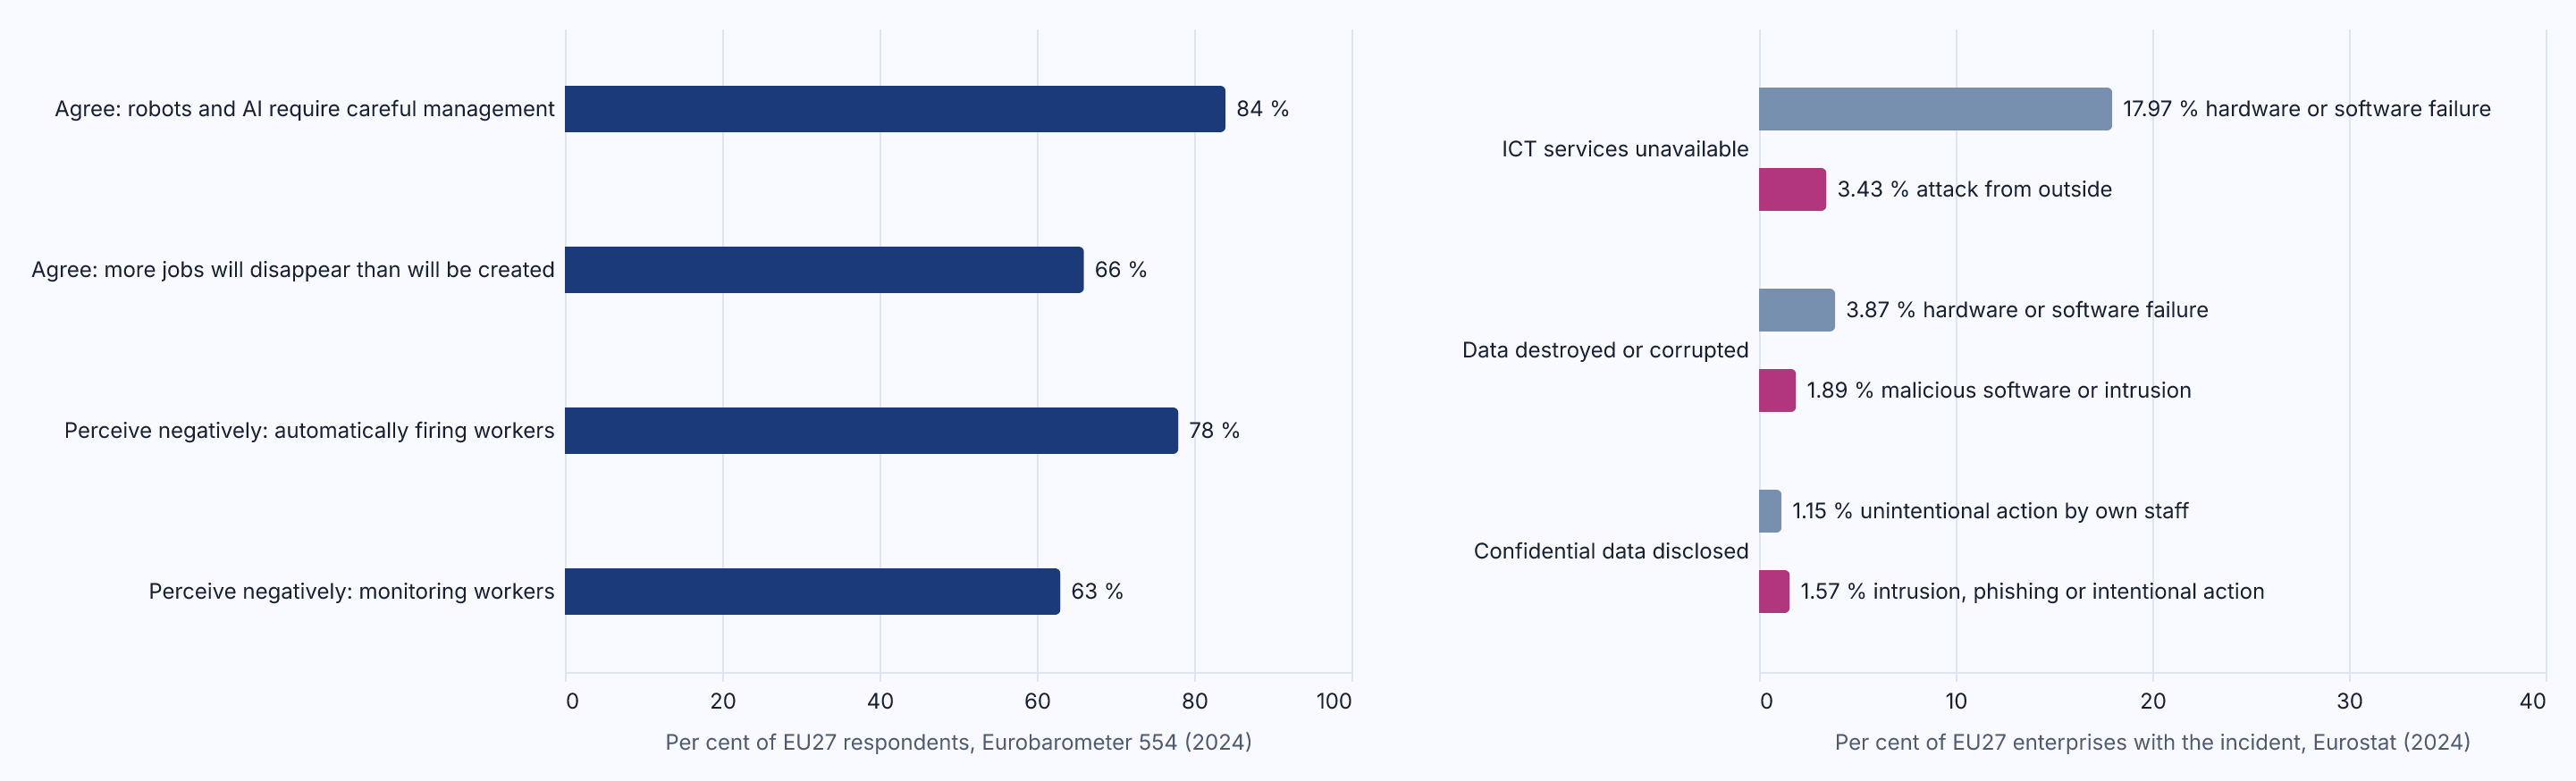
Figure 9.3: Left, the share of EU27 respondents to Special Eurobarometer 554 (fieldwork April to May 2024) who agree that robots and AI require careful management, who agree that more jobs will disappear than will be created, and who perceive automatically firing workers and monitoring workers negatively; right, the share of EU27 enterprises with ten or more persons employed that reported ICT security incidents in the 2024 survey, by consequence, failures and mistakes against attacks and malicious acts. The two panels measure different populations and are set side by side, not compared. Source: European Commission, Special Eurobarometer 554 (2025); Eurostat, isoc_cisce_ic (retrieved 2026).
Figure 9.3 puts the two kinds of evidence on one page without pretending they share a scale. They sit side by side because a leader, an official or a journalist has both in front of them at once and must decide which to act on. The public's named concerns, dismissal, surveillance, selection and personal data, are about decisions and data handling at work, not about the machine that acts alone, and the records show quiet failures as the common case. The gap this chapter concerns is therefore not between the public and the facts. It lies in which stories are told and then taken to the agenda, which neither dataset measures.
The picture corrected
In Contour, the notation of this book (Chapter 4), each AI use is a mark on a grid of autonomy levels and reversibility tiers. The marks this chapter reads carry three signs of control: a diamond when a policy point outside the model enforces what the unit may do, a grey seat above the mark carrying the tier of the person who holds the decision right (no seat means nobody is named), and a baseline under the mark, solid when the system itself produces the proof that the controls hold and dashed when a person or a supplier declares it. The cell at Level 4 Autonomous and R4 Irreversible is the empty corner.
The fear instinct reads a landscape from the top right: the empty corner, then the biggest square in the Level 3 and Level 4 columns. Chapter 4's reading order begins there too, and rightly. But the order continues: find the marks without a seat, find the dashed baselines at R3, and look at the colours, because Mode 0 marks without a seat are AI nobody chose. Figure 9.4 shows what that looks like.
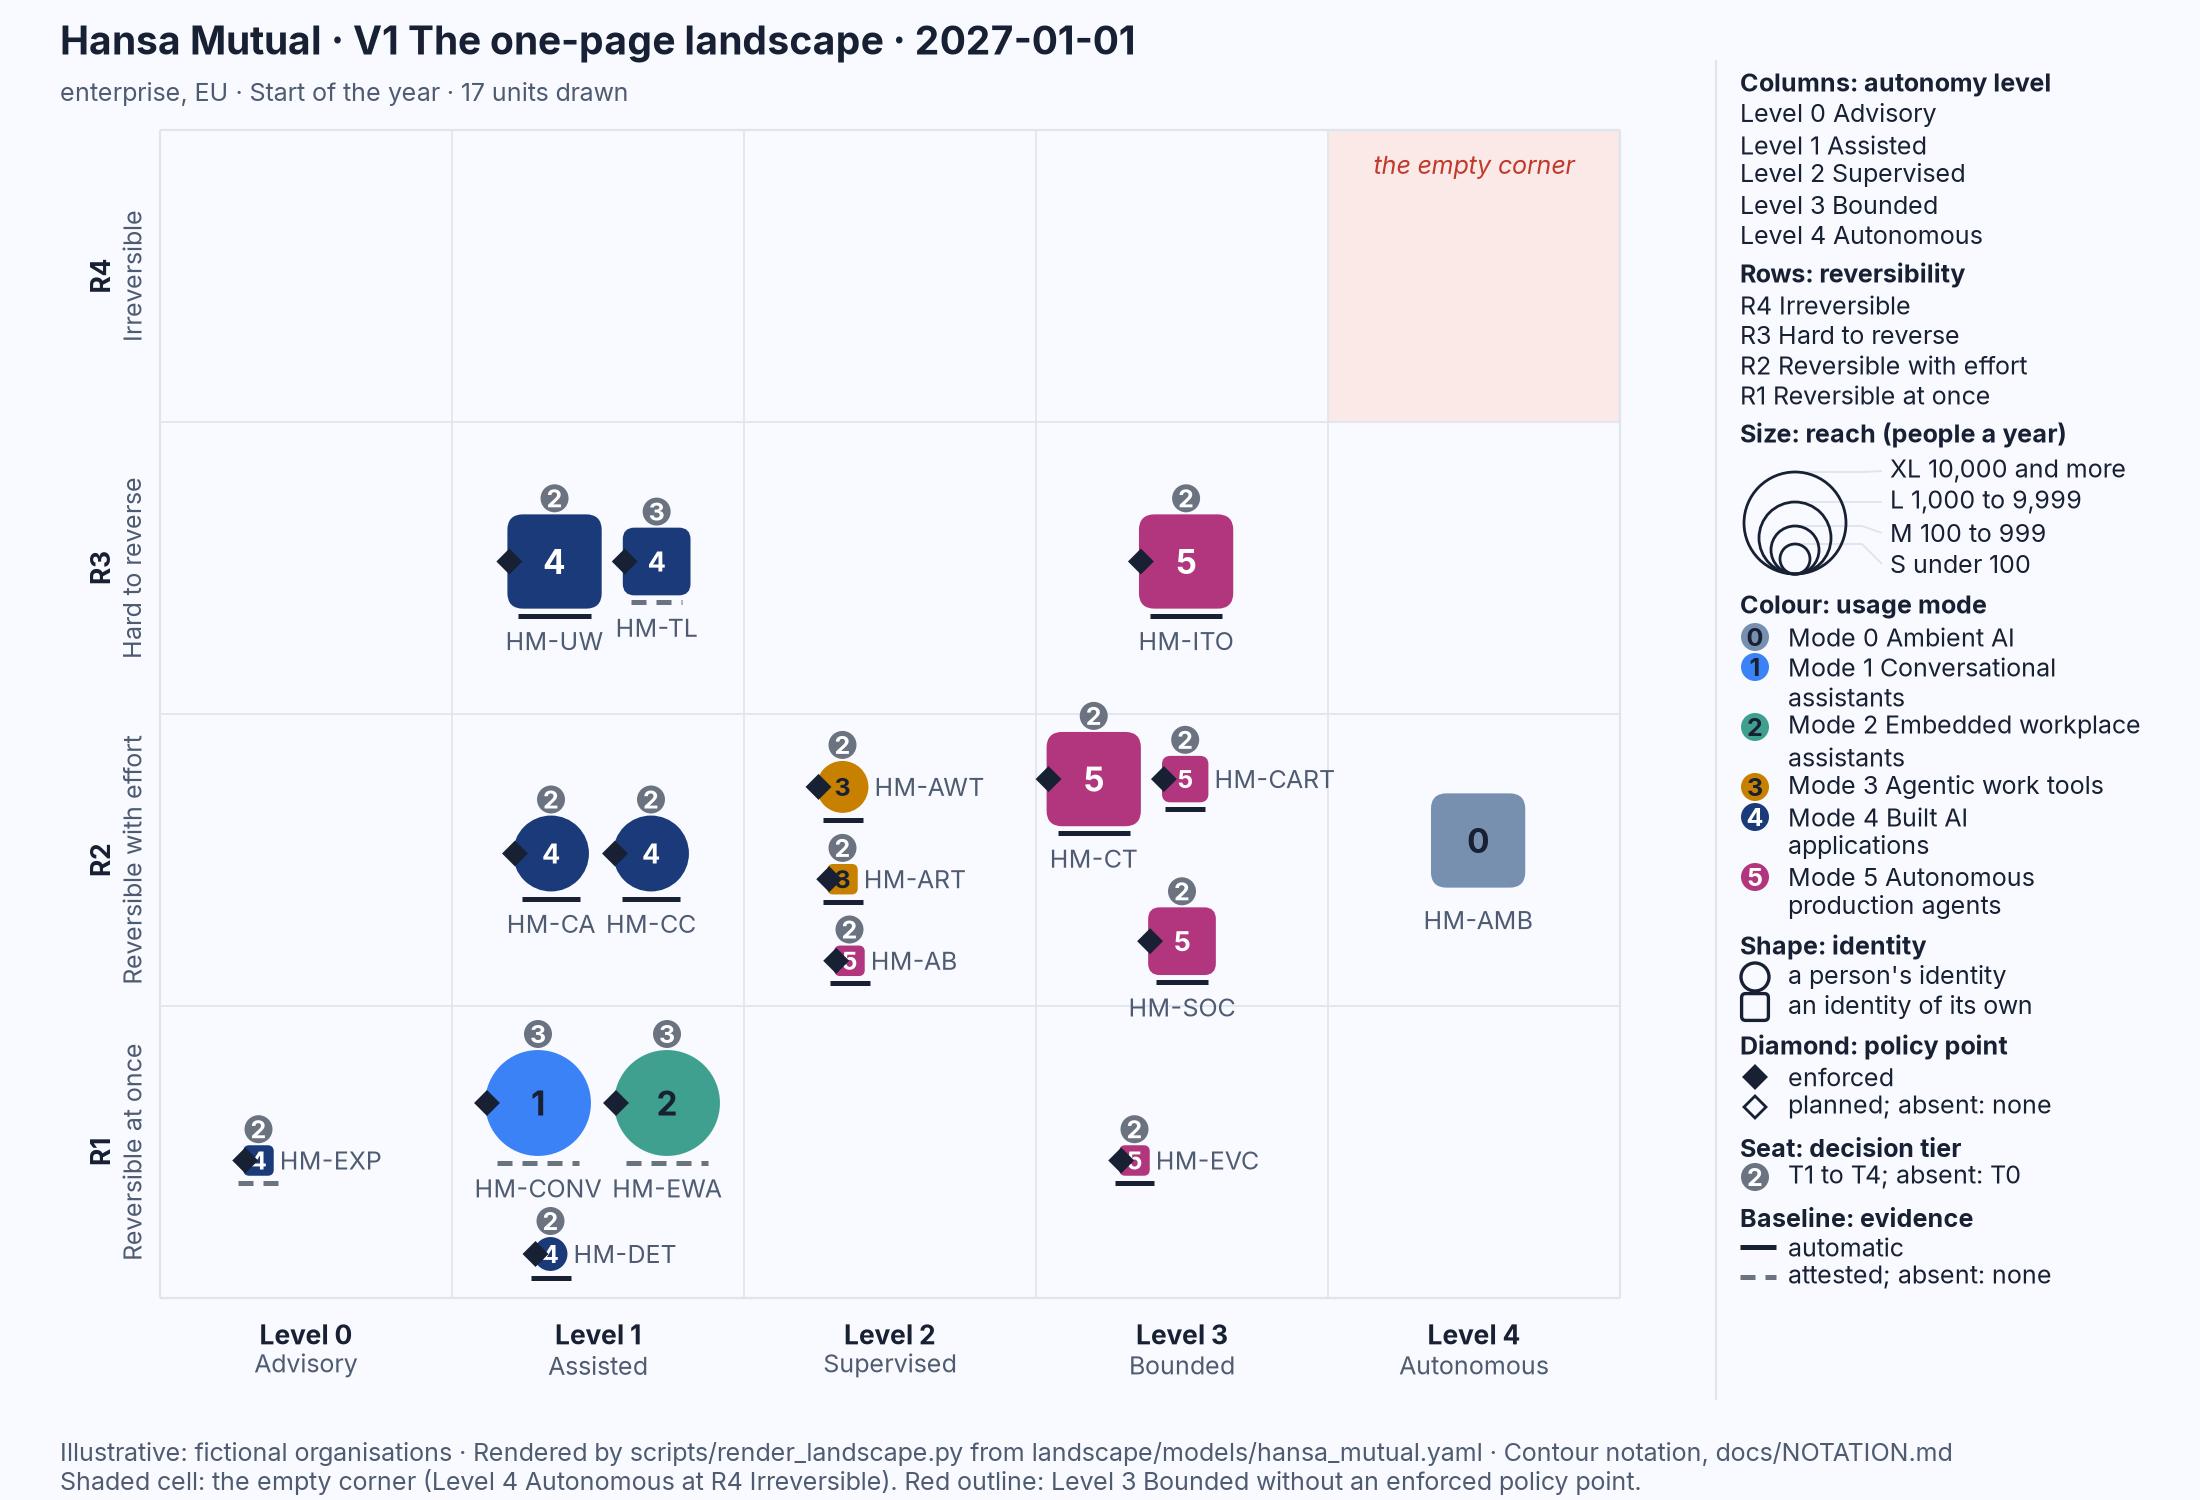
Figure 9.4: Hansa Mutual's landscape on 1 January 2027 in V1, the one-page landscape: the empty corner is empty, the agents at Level 3 Bounded carry filled diamonds, seats and solid baselines, and the marks that need attention are the Mode 0 square at Level 4 Autonomous without a seat and the dashed baseline at R3 Hard to reverse. Illustrative: rendered from landscape/models/hansa_mutual.yaml.
Hansa Mutual is a fictional mutual insurance group, and the view is rendered from its landscape model, not from data. Read it in order. The empty corner is empty. Next the squares at Level 3 Bounded, which are the agents: five, all in the magenta of Mode 5, the IT-operations agent HM-ITO at R3, the claims-triage agent HM-CT, the SOC investigation agent HM-SOC and the continuous red-teaming unit HM-CART at R2, and the evidence-collection agent HM-EVC at R1. A sixth Mode 5 unit, the agent-boss pilot HM-AB, sits at Level 2. Every Level 3 mark has a filled diamond, a seat marked T2, the system owner, and a solid baseline. These are the marks the fear instinct would point at, and they are the best-governed marks on the page.
Now the quiet marks. In the Level 4 Autonomous column, at R2, sits a grey square labelled 0: HM-AMB, the AI features that vendors switched on inside the licensed software the group uses across seven markets. It is a square because it acts under the vendors' identities, at Level 4 because the vendors, not Hansa, chose the autonomy level, and XL because it touches everyone. It has no diamond, no seat and no baseline: nobody is named as deciding about it, nothing enforces what it may do, and there is no evidence of any kind. It is the only mark on the page at Level 4, and it arrived as features in products people already had; AI Red Team, Chapter 8, calls Mode 0 the blind spot for this reason (4, Nordqvist, 2026). Then look along the R3 row for dashed baselines. There is one: HM-TL, the recruitment screening and video-interview service, a procured high-risk system at Level 1 Assisted with a seat at T3 and a filled diamond but a dashed line beneath it, because its controls are attested by the supplier, not shown by the system. A ranking of job applicants is a quiet harm when it goes wrong, and here it is the mark whose proof is a promise. Three more dashed baselines sit in the bottom row, where a failure is reversible at once.
The loud harm, the agent with write access, is on the page, controlled, seated and evidenced. The two marks that need a decision are quiet ones: a Mode 0 square without a seat and a dashed line under a high-risk system at R3. A reader who looked only at the top right would go home reassured.
The rule of thumb
Rule of thumb: When a story frightens you, find the base rate and the quiet harm it hides.
The rule has two steps. The base rate turns a story into a frequency. For a ransomware story the base rate in this chapter is 3.43 per cent of enterprises with an outage by attack, beside 17.97 with an outage by failure; for a rogue-agent story it is 3 incidents in 1,498 under the heading "AI pursuing its own goals in conflict with human goals or values", beside 412 under fraud. The base rate does not make the story false; it says how much of the agenda it has earned. The second step asks what the story displaced: which harm with a higher base rate and a less frightening shape was not discussed because this one was. That is where the design work is.
The rule stops applying when the hazard is real, immediate and in your own landscape: if there is a mark in the empty corner, the EU base rate is no help. It also stops applying to the tail that has no base rate yet, since a harm that has not happened cannot be counted; the evidence ladder places such claims honestly rather than dismissing them because the count is zero. The rule is for the agenda, not for the register: it decides what is discussed first, and the register keeps the rest.
What to do
For an executive
When a frightening story reaches the board, ask for two numbers before the discussion starts: the base rate of that harm in the best public record, and the organisation's own count of the quiet harms for the same period, outages, fraud against customers or residents, complaints about automated decisions, data disclosed by mistake. Then read the landscape in full. Give the Mode 0 square a seat: name the person who decides about vendor-enabled features, and ask what the vendors have switched on. Ask whose proof the dashed baseline at R3 rests on and when it was last tested.
For an architect
Record every incident in the vocabulary of the landscape, so that a year of incidents can be counted by cell rather than by headline. The record below is illustrative: it names the unit as the landscape model names it, places the incident at the unit's level and tier, classifies the cause in the categories Eurostat uses and the harm in the domains the AI Incident Database uses, and names the holder of the decision right.
# Incident record, illustrative. One record per incident; the unit fields
# are copied from the landscape model at the time of the incident.
incident:
  id: INC-2027-0412
  date: 2027-03-09
  unit: XX-AMB                  # id in landscape/models/<org>.yaml
  mode: 0                       # Mode 0 Ambient AI
  identity: own                 # acts under the vendor's identity
  level: 4                      # Level 4 Autonomous, chosen by the vendor
  reversibility: R2             # Reversible with effort
  reach: XL
  cause: failure                # failure | attack | unintentional-action
  cause_detail: vendor feature misfiled archived case mail after an update
  consequence: unavailability   # unavailability | data-loss | disclosure
  harm_domain: ai-system-safety-failures-and-limitations   # AIID taxonomy
  people_affected: 1400
  detected_by: service desk tickets, not by the unit's own telemetry
  decision_holder: none         # T0 at the time; see follow_up
  policy_point: none
  evidence_at_time: none
  reversed_on: 2027-03-11
  follow_up:
    - landscape_change: {unit: XX-AMB, decision_tier: T2, date: 2027-03-31}
    - contract_change: vendor notice of feature changes before rollout
Every incident record that changes a dimension of a unit becomes a dated entry in that unit's timeline in the landscape model, so that the time view of Chapter 15 shows the seat appearing or the baseline turning solid. At the end of the year, count the records by cause and by cell; if most incidents were failures at Level 0 and Level 1 while most design effort went into the agents at Level 3, the count says so.
For a public official
Public administration is the most targeted sector in ENISA's sector-attributed record, mostly by denial of service claimed by hacktivists, loud and usually brief (38, ENISA, 2025). The harms that reach residents are quieter: a case system down for a day because a server failed, a benefit deprioritised by a ranking nobody can explain, a letter sent to the wrong address by a feature a vendor switched on. When you report to an elected body about AI risk, report both columns of Figure 9.3 and say which one the authority can act on, then point at the Mode 0 marks without a seat and the dashed baselines at R3, because those are the marks a public body can fix by decision and contract. Keep the catastrophic scenario in the risk register, labelled speculation, without letting it take the decisions that the quiet harms need.
Nordvik Region and Hansa Mutual
Both organisations are illustrative, and everything here is taken from their profiles and their landscape models. At Nordvik Region the fear arrives through the front door of democracy. In September 2026 a group in the regional council tabled a motion asking the regional director to report whether the Region should pause its use of AI until the risks were understood, and the council referred it to its audit committee with a deadline at the end of the first quarter of 2027. The question the politicians asked was the rogue-agent question. The Region's landscape answers it at a glance: no Mode 5 mark, agentic work tools limited to a small platform team at Level 2 Supervised, the empty corner empty, and one built system at Level 4, the citizen-service assistant, with a filled diamond, a seat and a solid baseline. What the landscape also shows, and the motion did not ask about, is the same grey square Hansa has: NR-AMB, ambient AI in licensed software, at Level 4 Autonomous with no seat, no diamond and no baseline. The Region's largest exposure, in the words of its profile, lies elsewhere again, in the benefits-triage system that orders residents' applications, a Mode 4 mark at Level 0 Advisory and R3, where a harm would be quiet and slow.
At Hansa Mutual the fear sits in the risk committee of the executive board, which in October 2026 asked whether AI loss of control belonged in the group's own risk and solvency assessment. The mark the committee has in mind is HM-ITO, the IT-operations agent with write access to production, the magenta square at Level 3 Bounded and R3 in Figure 9.4. In the scenario of Chapter 18 the measured answer is a stop drill, whose first run in the first quarter of 2027 takes 17 minutes against a budget of 5, because the alert reaches a duty analyst who does not hold the decision and the access tokens outlive revocation. That is the fear instinct working as it should: a real hazard in the organisation's own landscape, a test that measures it, and a decision recorded at the seat. What the committee does not ask about is HM-AMB, the same grey square as Nordvik's, and HM-TL, whose dashed baseline at R3 is the supplier's attestation. Nordvik's fear comes from elected politicians and finds no agents; Hansa's comes from a board and finds one. In both landscapes the quiet marks are the same two, and in both they wait longer.
Summary
The chapter opened with what people say they are concerned about and what the records contain. In the European Commission's 2024 probability survey, 84 per cent of respondents agreed that robots and AI require careful management and 78 per cent perceived automatic dismissal negatively; the concerns named were quiet ones: jobs, monitoring and dismissal. The records speak of the same quiet ground. In Eurostat's 2024 survey 21.54 per cent of EU enterprises reported an ICT security incident, and outages by failure, 17.97 per cent, outnumbered outages by attack, 3.43 per cent, by about five to one. ENISA's 4,875 incidents were 76.7 per cent denial of service. In the AI Incident Database, 566 of 1,498 classified incidents are people using AI against people; 3 are an AI pursuing goals of its own. Question 7 rests on the Eurostat record.
The fear instinct lets the frightening story set the agenda. It is useful where the hazard is real, immediate and in the organisation's own landscape, and the stop drill is its proper expression. It misleads when the frightening story displaces the quiet, counted harms, service failures, fraud, discrimination and disclosure by mistake. The surveys do not show that respondents fear the wrong things; the claim is about which harm is discussed first, and that is described here, not measured. The evidence ladder of AI Threat places each claim where its evidence reaches: fraud and discrimination by means of AI are patterns at scale, agents acting beyond their mandate are incidents in the wild, and a system escaping control to catastrophic effect remains speculation.
The picture corrected is V1 read in full. On Hansa Mutual's illustrative landscape the empty corner is empty and the agents at Level 3 Bounded are the best-controlled marks on the page; the marks that need a decision are a Mode 0 square at Level 4 Autonomous without a seat, and a dashed baseline under a high-risk system at R3 Hard to reverse. The rule of thumb follows: when a story frightens you, find the base rate and the quiet harm it hides. The executive asks for the base rate and the organisation's own count of quiet harms; the architect records every incident in the vocabulary of the landscape; the public official reports both columns and points at the marks a public body can fix by decision and contract.
The fear instinct concerns which harms are discussed. The next instinct concerns how large the discussed numbers are. Chapter 10 turns to the size instinct, and to numbers that arrive without their denominators.
Sources
- European Commission, Directorate-General for Employment, Social Affairs and Inclusion (2025). Artificial Intelligence and the future of work. Special Eurobarometer 554, Publications Office of the European Union. (29, European Commission, 2025)
- McClain, C., Kennedy, B., Gottfried, J., Anderson, M. and Pasquini, G. (2025). How the U.S. Public and AI Experts View Artificial Intelligence. Pew Research Center, Washington, D.C. (32, McClain et al., 2025)
- Poushter, J., Fagan, M. and Corichi, M. (2025). How People Around the World View AI. Pew Research Center, Washington, D.C. (33, Poushter et al., 2025)
- Ipsos (2025). The Ipsos AI Monitor 2025: A 30-country Ipsos Global Advisor Survey. Ipsos (vendor survey). (31, Ipsos, 2025)
- Eurostat (2026). Security incidents and consequences by size class of enterprise. Online data code isoc_cisce_ic. (11, Eurostat, 2026)
- European Union Agency for Cybersecurity (ENISA) (2024). ENISA Threat Landscape 2024. ENISA. (37, ENISA, 2024)
- European Union Agency for Cybersecurity (ENISA) (2025). ENISA Threat Landscape 2025. ENISA. (38, ENISA, 2025)
- Responsible AI Collaborative (2026). AI Incident Database. incidentdatabase.ai, snapshot of 2 November 2026. (35, Responsible AI Collaborative, 2026)
- McGregor, S. (2021). Preventing Repeated Real World AI Failures by Cataloging Incidents: The AI Incident Database. Proceedings of the AAAI Conference on Artificial Intelligence, 35(17). (50, McGregor, 2021)
- Rosling, H., Rosling, O. and Rosling Rönnlund, A. (2018). Factfulness: Ten Reasons We're Wrong About the World – and Why Things Are Better Than You Think. London: Sceptre. (8, Rosling et al., 2018)
- Nordqvist, G. (2026). AI Red Team: AI as an Active Part of Cyber Defence in European Enterprises and Public Authorities. aired.geon.se. (4, Nordqvist, 2026)
- Nordqvist, G. (2026). AI Threat: Are the Dystopias Coming True? Evidence, Risk and Response for European Enterprises and Public Authorities. aithreat.geon.se. (5, Nordqvist, 2026)