The Notation: One Picture, Drawn the Same Way Every Time
In the scenario of this book, on the first working day of 2027 the regional director of Nordvik Region is handed one page. Nordvik Region is a regional public authority in a Nordic member state of the European Union, with about 6,000 employees and about 450,000 residents; it is one of the two fictional organisations in this book, and everything said about it is illustrative. The page carries a grid of five columns and four rows and eleven coloured marks. It shows where in the Region software acts without a person approving each step, how hard each action would be to undo, how many people it touches in a year, with whose permissions it runs, whether anything outside the software limits it, who has put their name to it, and how the Region would know if the controls had stopped working.
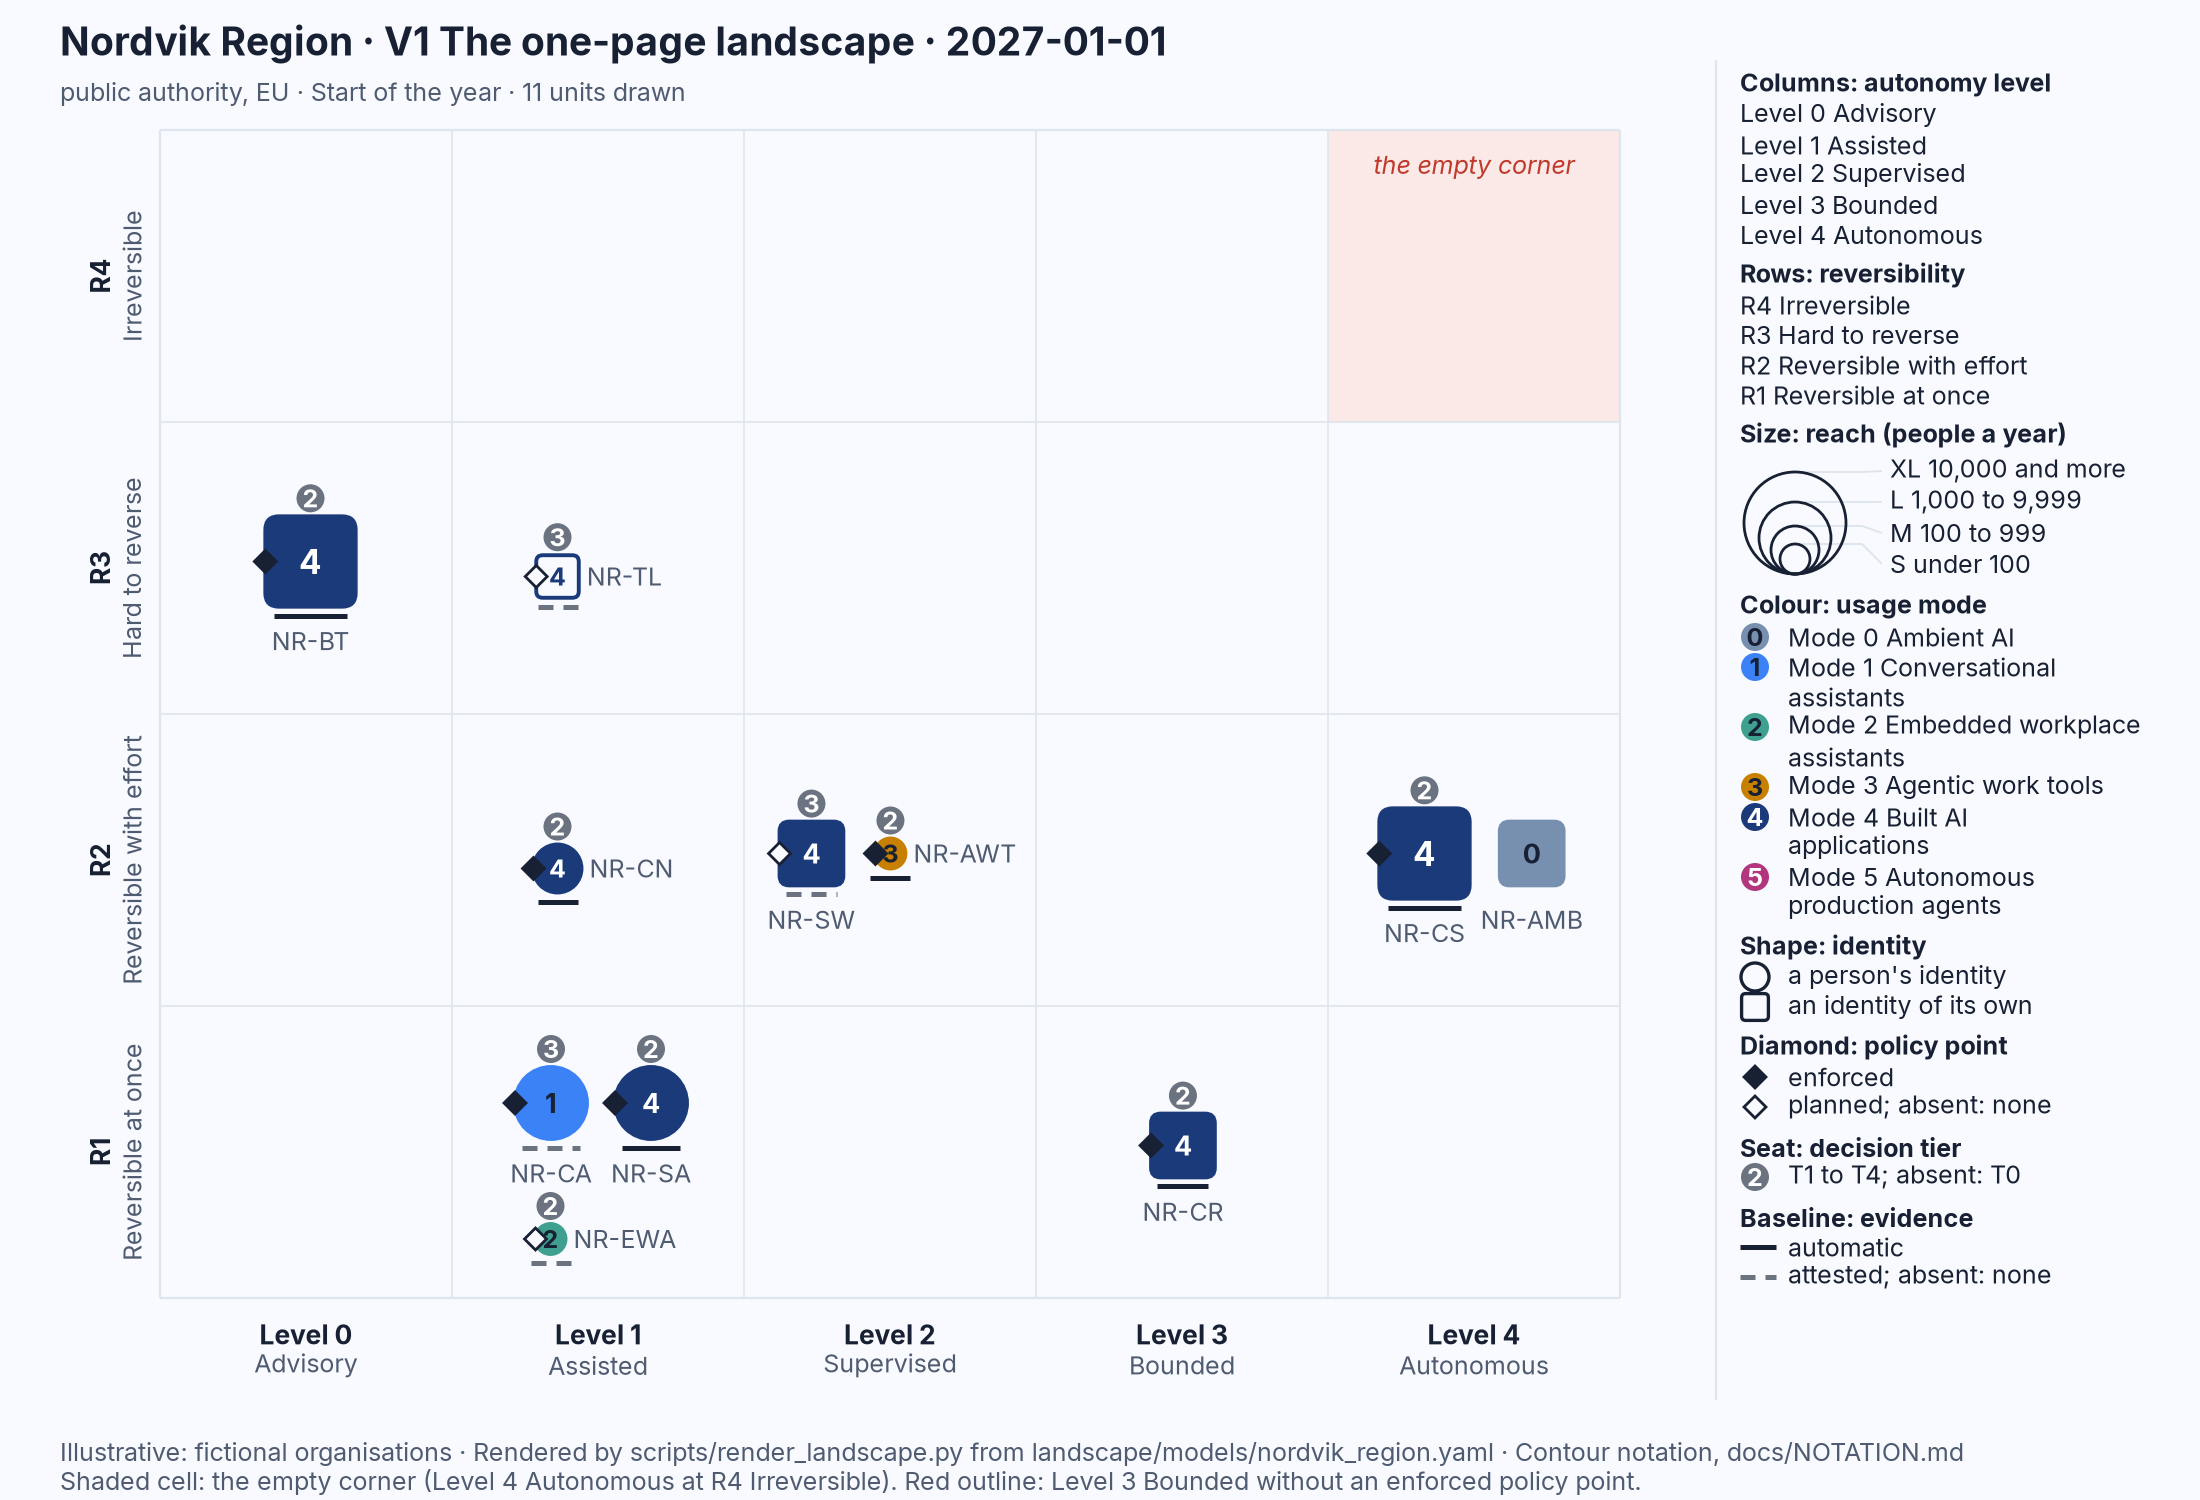
Figure 4.1: Nordvik Region's landscape at the start of 2027, V1 The one-page landscape: eleven units drawn by autonomy level, reversibility tier, reach, usage mode, identity, control and evidence. Illustrative: rendered from landscape/models/nordvik_region.yaml.
The page is drawn in Contour, the notation of this book, and this chapter teaches it. Chapter 3 defined in words the landscape it draws. Here I read one mark aloud, explain each of the seven dimensions, then show the frames, the views, what the notation leaves out and how to read any landscape in a fixed order. The chapter ends with pen and paper: Contour is designed so that it can be sketched on a whiteboard, and the renderer makes the sketch exact, not possible.
A first mark, read aloud
Start with the grid. The five columns are autonomy levels, from Level 0 Advisory on the left to Level 4 Autonomous on the right: the further right a mark sits, the more its software does without a person approving each action. The four rows are reversibility tiers, from R1 Reversible at once at the bottom to R4 Irreversible at the top: the higher a mark sits, the harder its actions are to undo. The top-right cell, Level 4 Autonomous at R4 Irreversible, is shaded faintly and labelled "the empty corner". Here it is empty.
Now one mark. In the row R3 Hard to reverse, at Level 0 Advisory, sits NR-BT, the benefits-triage system, one of the two largest marks on the page. The column says it only suggests: it orders residents' applications for assistance by urgency, and a caseworker decides every case. The row says that its effect is hard to undo: a person's place in a queue cannot be put back once a month has passed. The size says it touches 10,000 or more people a year. The colour is navy, with a 4 inside it, the colour and number of Mode 4 Built AI applications, the way an organisation comes to use a model that Chapter 3 named. The mark carries four more signs, a rounded shape, a small diamond on its left edge, a grey circle above it and a line beneath it; they are taught in the sections below, and nothing in this paragraph depends on them.
One more mark is worth finding now. In the rightmost column, beside the large navy NR-CS, stands NR-AMB, a small grey-blue square with a 0 inside it and nothing else around it. By the end of the chapter the reader will know what that bareness records.
Why seven dimensions, and why these
Hans Rosling replaced two boxes with four income levels because the data lay on a continuum and the boxes hid it (8, Rosling et al., 2018). The one box labelled "AI" hides more, because what an AI use can do depends on several properties at once, and none of them is the model's name.
Contour draws one unit as one mark. A unit is one AI use: one way in which an organisation puts a model to work, with the people who work with it; the same model used in two ways is two units. I chose the use as the unit because, as Chapter 3 showed, a use drifts between modes while its controls stay behind, and a picture of products would miss the drift.
Every mark carries seven dimensions and nothing else, because each answers one question that decides what an AI use can do.
| Dimension | The question | Drawn as | Scale |
|---|---|---|---|
| Autonomy level | What may it do without a person approving each action? | Column | Level 0 Advisory to Level 4 Autonomous |
| Reversibility | What would it take to undo what it does? | Row | R1 Reversible at once to R4 Irreversible |
| Reach | How many people does it touch in a year? | Size | S, M, L, XL |
| Usage mode | How did the organisation come to use it? | Colour | Mode 0 Ambient AI to Mode 5 Autonomous production agents |
| Identity | With whose identity does it act? | Shape | Circle (a person's) or rounded square (its own) |
| Control | What enforces its limits, and who decides? | Diamond and seat | Policy point; decision tier T1 to T4 |
| Evidence | Where does the proof come from? | Baseline | Solid (automatic) or dashed (attested) |
Two of the scales, the modes and the levels, are adopted from the series by their exact names; the reversibility tiers, the reach classes, the decision tiers and the kinds of evidence are this book's own.
Columns: what the AI may do
The column is the autonomy level, the five levels adopted in Chapter 3: Level 0 Advisory, Level 1 Assisted, Level 2 Supervised, Level 3 Bounded and Level 4 Autonomous. The line between Level 2 and Level 3 is the most important in the scheme, and the level is the horizontal axis so that the eye reads it first.
A unit with several kinds of action is drawn at the highest level it holds for any action that changes something outside the unit. Read-only actions, such as enriching an alert, do not set the column, because autonomy over a read changes nothing that would need undoing. The decision-rights view, described below, shows the level of each class of action, read-only ones included. The level is decided and recorded, not discovered, so a column states a decision somebody took or, for a mark without a seat, one nobody took.
Rows: what it would take to undo
The row is the reversibility tier: what it would take to undo the action the AI takes or shapes. The four tiers are this book's own. R1 Reversible at once: undone in minutes, and nothing has left the organisation, as with a draft. R2 Reversible with effort: hours to days and a known procedure, as with a roster. R3 Hard to reverse: a person's outcome, money or disclosed data is affected and reversal takes weeks, as with a benefit application deprioritised for a month. R4 Irreversible: physical action, safety, legal finality, destroyed records or disclosure to the world.
A unit with several classes of action is drawn at the tier of the hardest to reverse, while the column holds the highest level of any action that changes something. The two come from different actions, so a mark can sit at Level 3 and R3 though no single action does. Hansa Mutual's IT-operations agent restarts a service at Level 3, which can be undone; it changes a production configuration, which is hard to reverse, only at Level 2; and it may not delete data. The mark sits at Level 3 and R3.
The two axes together carry a rule the series reached more than once: Level 4 Autonomous is never used for offensive or irreversible actions, and irreversible actions stay at or below Level 2 Supervised (AI Red Team, Chapter 6) (4, Nordqvist, 2026). AI Boss, Chapters 4 and 33, draws the same line for people: Level 4 Autonomous is never used for the management function that carries consequences for a person (7, Nordqvist, 2026). The top-right cell is where those conclusions meet. The notation names it the empty corner and shades it in every view, so that an empty cell says "nothing is here, and that is right". The emptiness is a rule of the drawing, not a finding: a landscape that put a mark there would be flagged, not hidden.
Size, colour and shape
Reach
The size of a mark is its reach: the number of people whose work or outcomes the unit's actions touch in a year. It is drawn as one of four fixed sizes: S under 100 people, M 100 to 999, L 1,000 to 9,999 and XL 10,000 and more. Each class is larger than the last, but the drawn sizes do not grow tenfold with the classes, so read the size as a class, not as a count. Reach is an absolute count of people, not a share of the organisation's population, and it counts people, not transactions. I chose people because the book asks who is affected, not how many records move.
Usage mode
The fill colour is the usage mode, one of the six defined in Chapter 3: grey-blue for Mode 0 Ambient AI, blue for Mode 1 Conversational assistants, green for Mode 2 Embedded workplace assistants, amber for Mode 3 Agentic work tools, navy for Mode 4 Built AI applications and plum for Mode 5 Autonomous production agents. The mode's number sits inside or beside the mark, so that no figure depends on colour alone. Mode is drawn because the usage mode, not the brand, sets the governance (2, Nordqvist, 2026). The grey-blue square is the mode nobody plans, drawn.
Identity
The shape is the identity. A circle means the unit acts with a person's identity and permissions, as an assistant does. A rounded square means it acts with an identity of its own: a service account, an agent with its own credentials, a vendor feature acting under the vendor's identity. The shape is the thing to check at Level 3 Bounded or above: a square there is an agent; a circle there is a person's account being used without that person approving each action. I call that anti-pattern delegated access without delegation; the term is this book's own. AI Platform and Security, Chapter 12, describes the safe alternative, delegated authority in which the person stays visible in every downstream call (3, Nordqvist, 2026).
Diamond, seat and baseline
Three small signs carry the control and evidence dimensions. Each has its own place on the mark, and each has one meaning.
The policy point
The small diamond on the left edge is the policy point, the policy decision point of Chapter 3: a component outside the model that enforces what the unit may call, read, write or send. Filled, it is enforced; hollow, planned; absent, none. One drawing rule follows from the argument of Chapter 3: a Level 3 Bounded mark without a filled diamond is drawn with a thin red outline, because such a mark is Level 4 with a misleading label.
The seat
The small grey circle above a mark is the seat, carrying the decision tier of the person who holds the decision right for the unit: T1 the operator or user, T2 the system owner or architect, T3 an executive, T4 the board or an elected body. When nobody is named the tier is T0 and the seat is absent. People are drawn only here, because the book's question about people is who decides, not who reports to whom. A seat records who holds the right; whether that person also has the means to stop the unit is a separate question that Chapter 17 takes up.
The baseline
The short line under a mark is the evidence baseline: where proof that the controls hold comes from. Solid is automatic evidence, produced by the system: logs, test results, gates and policies as code. Dashed is attested evidence, declared by a person or a supplier: a contract clause or a signed attestation. No line means none.
Read NR-BT again with all three. The diamond is filled: a policy point outside the model enforces what it may read and write. The seat carries a 2: a system owner holds the decision right. The baseline is solid: the proof that these controls hold is produced by the system itself. For NR-TL, the recruitment screening pilot paused since September 2026, the diamond is hollow, the seat carries a 3 and the baseline is dashed: the policy point is planned, an executive holds the decision, and the proof of control is the supplier's word. NR-AMB has no diamond, no seat and no baseline: the vendors switched its features on and chose its autonomy level, and nobody in the Region holds a decision right, nothing outside the products limits them, and there is no evidence. The notation draws each missing control as an absence on the page.
Hansa Mutual's landscape, and a first comparison
The second organisation is Hansa Mutual, a mutual insurance group headquartered in Hamburg with about 9,500 employees, operating in seven countries inside and outside the European Union; it too is illustrative.
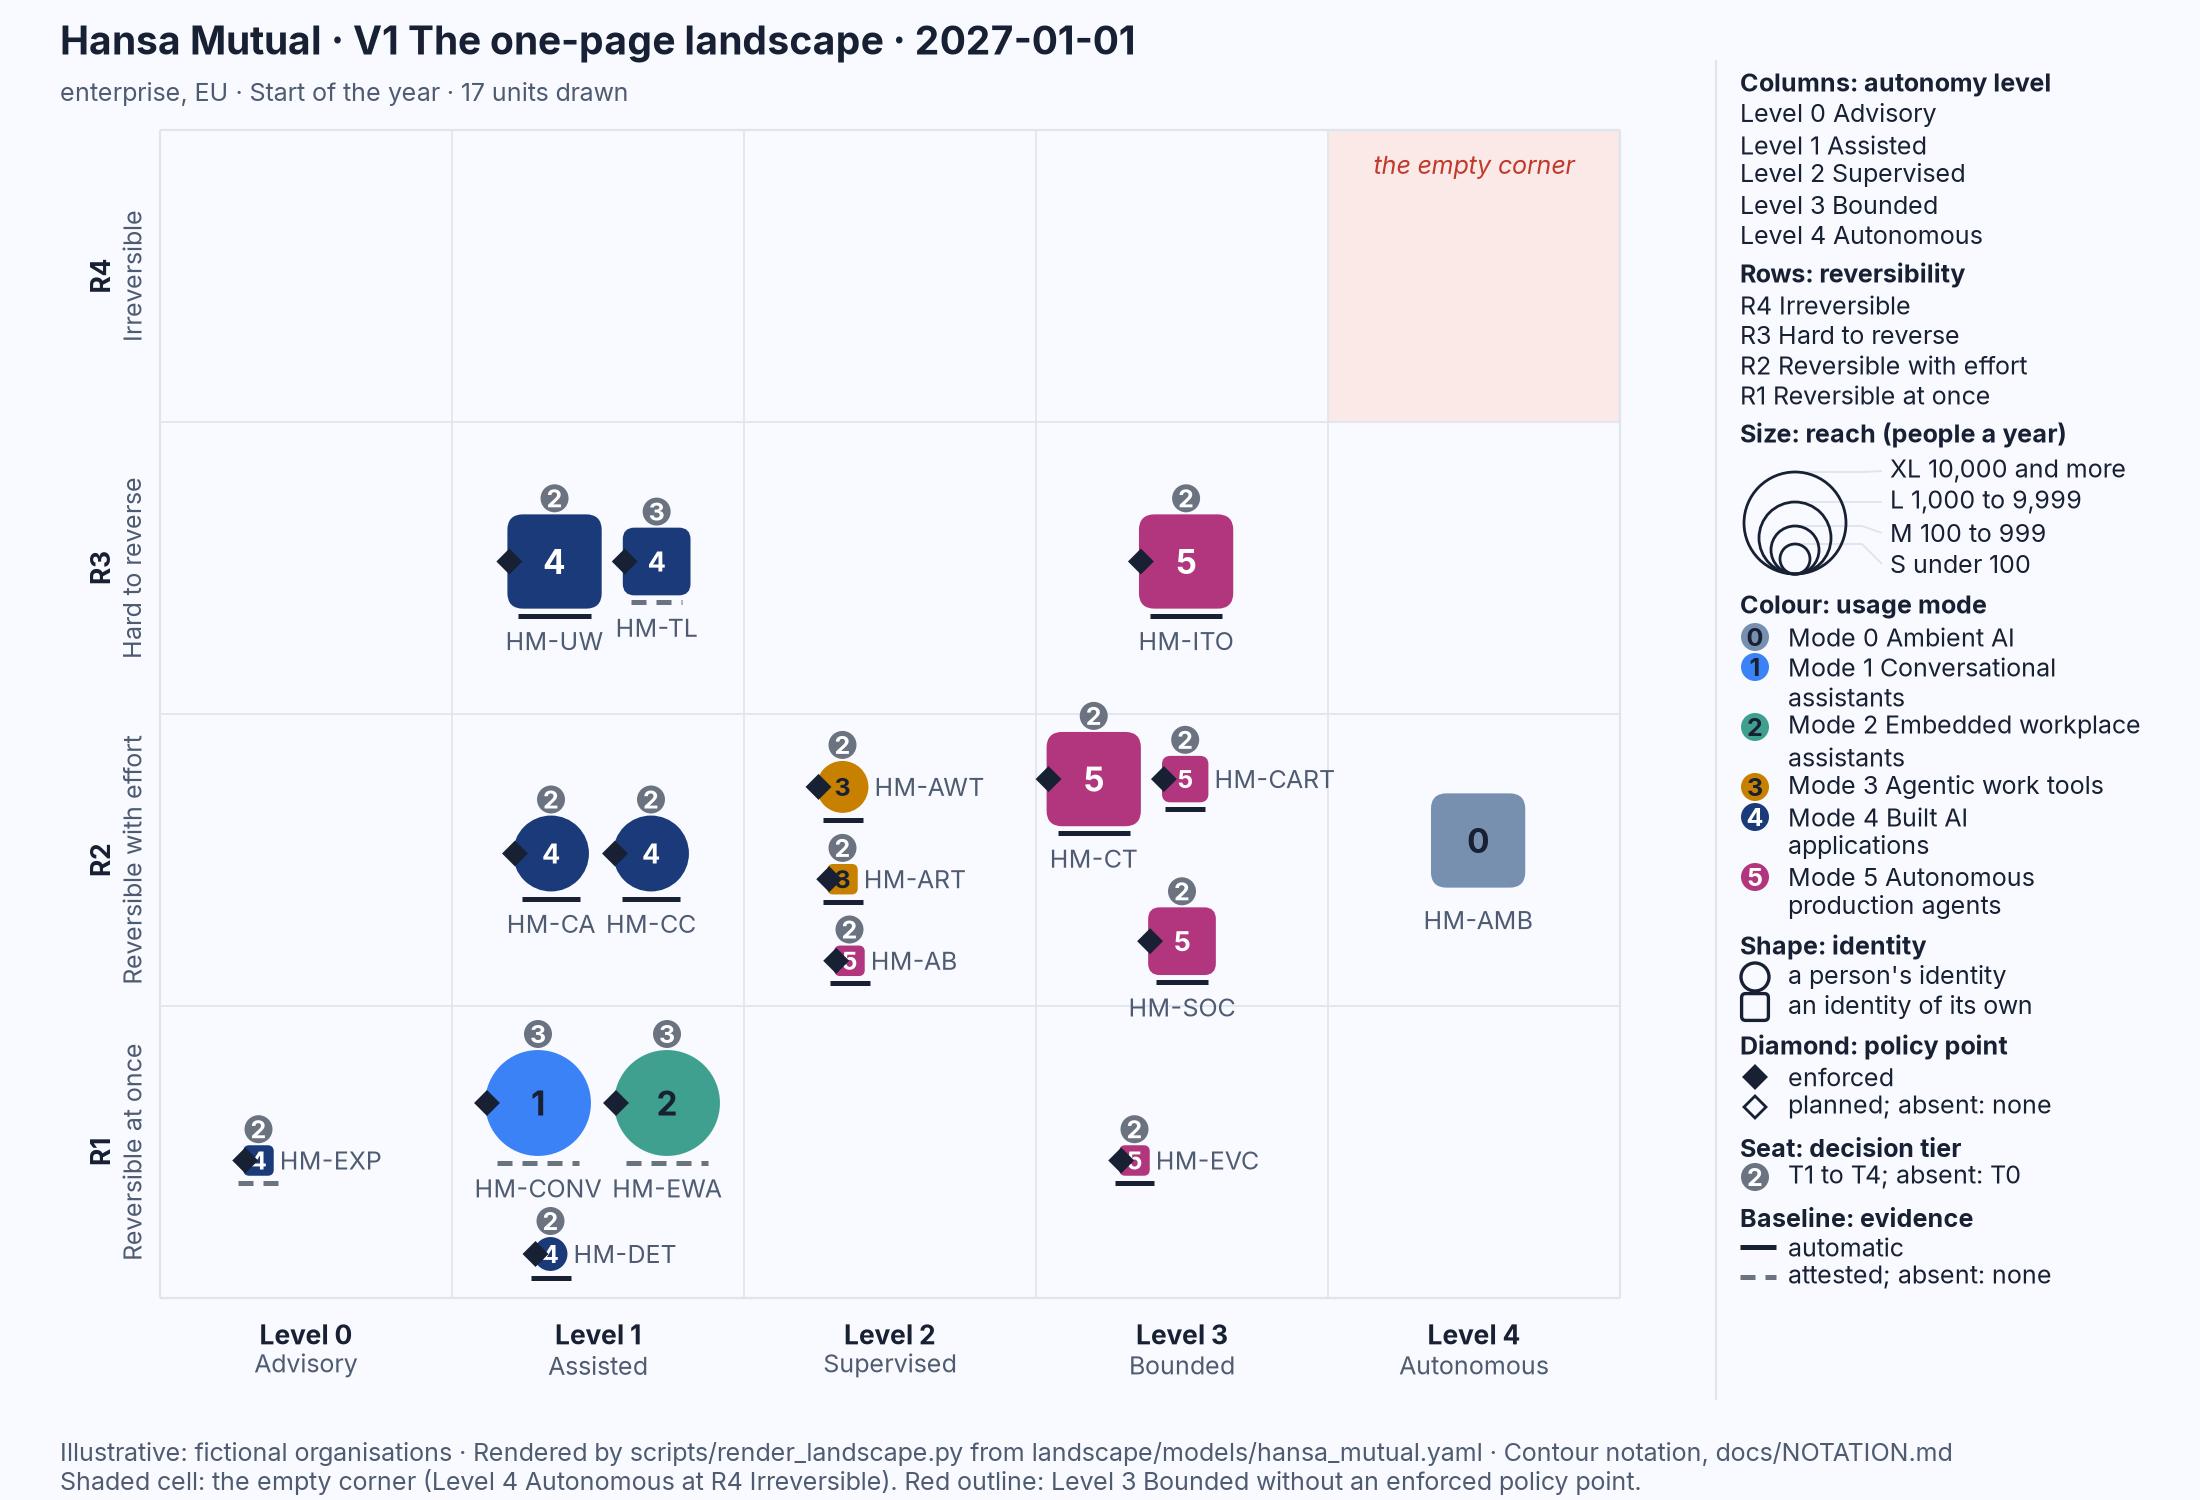
Figure 4.2: Hansa Mutual's landscape at the start of 2027, V1 The one-page landscape: seventeen units, including six autonomous production agents, each with a filled diamond and a seat. Illustrative: rendered from landscape/models/hansa_mutual.yaml.
Read it as Figure 4.1 was read. The empty corner is empty. The Level 3 Bounded column holds five plum squares of Mode 5 Autonomous production agents: HM-ITO, the IT-operations agent, at R3 Hard to reverse and size XL; HM-CT, the claims-triage agent, at R2 and size XL; HM-CART and HM-SOC, the automated red-teaming and security-investigation agents; and at R1 the small evidence-collection agent HM-EVC. The sixth plum square, HM-AB, a pilot in which two teams direct agents, stands at Level 2. Every one has a filled diamond, a seat carrying 2 and a solid baseline. At Level 4 Autonomous there is one square, HM-AMB, the same grey-blue 0 with nothing around it that Nordvik Region has.
The difference is visible without comparing a single number. Nordvik Region has no plum; Hansa Mutual has six plum squares, and governs them. Nordvik Region has four dashed baselines among eleven marks and three hollow diamonds; Hansa Mutual has four dashed baselines among seventeen and no hollow diamond.
The three frames
Three frames arrange the marks and add no dimension. The boundary frame draws containers as rounded rectangles: a solid border for the organisation's own boundary; a dashed border for a supplier, labelled by role (model provider, hosting, application or operations), never by brand; and a dotted border for a jurisdiction outside the EU and the EEA. A mark sits in the container of the supplier that hosts it; a thin line to a small chip labelled "model" says it takes its model from another supplier. The frame exists because model origin is a risk separate from hosting (2, Nordqvist, 2026); Chapter 16 teaches it.
The time frame draws change as a trail: a hollow outline of the mark at its earlier position, a thin line, and the filled mark at its later position, with the two dates under the view. A mark that appeared has a small "new" tick; a retired mark is drawn hollow with a cross. Time is a frame because uses drift between modes while their controls stay behind, and because the ability to take a delegated function back can fade within months, a point Chapter 3 marked as illustrated, not measured.
The comparison frame draws two landscapes side by side at identical scales, sizes and colours, with a shared legend and a summary strip under each. Nothing may be rescaled to fit. The series drew its two organisations in different layouts from volume to volume, and the frame exists so that a comparison is always like for like.
The six views
Each view is defined once and used throughout the book without redefinition. V1 The one-page landscape shows every unit as a mark on the autonomy by reversibility grid; Figures 4.1 and 4.2 are V1 views, and Chapter 14 teaches how to draw one. V2 The landscape over time is V1 with trails between two dates.
V3 The supply and sovereignty view places the same marks in the boundary containers.
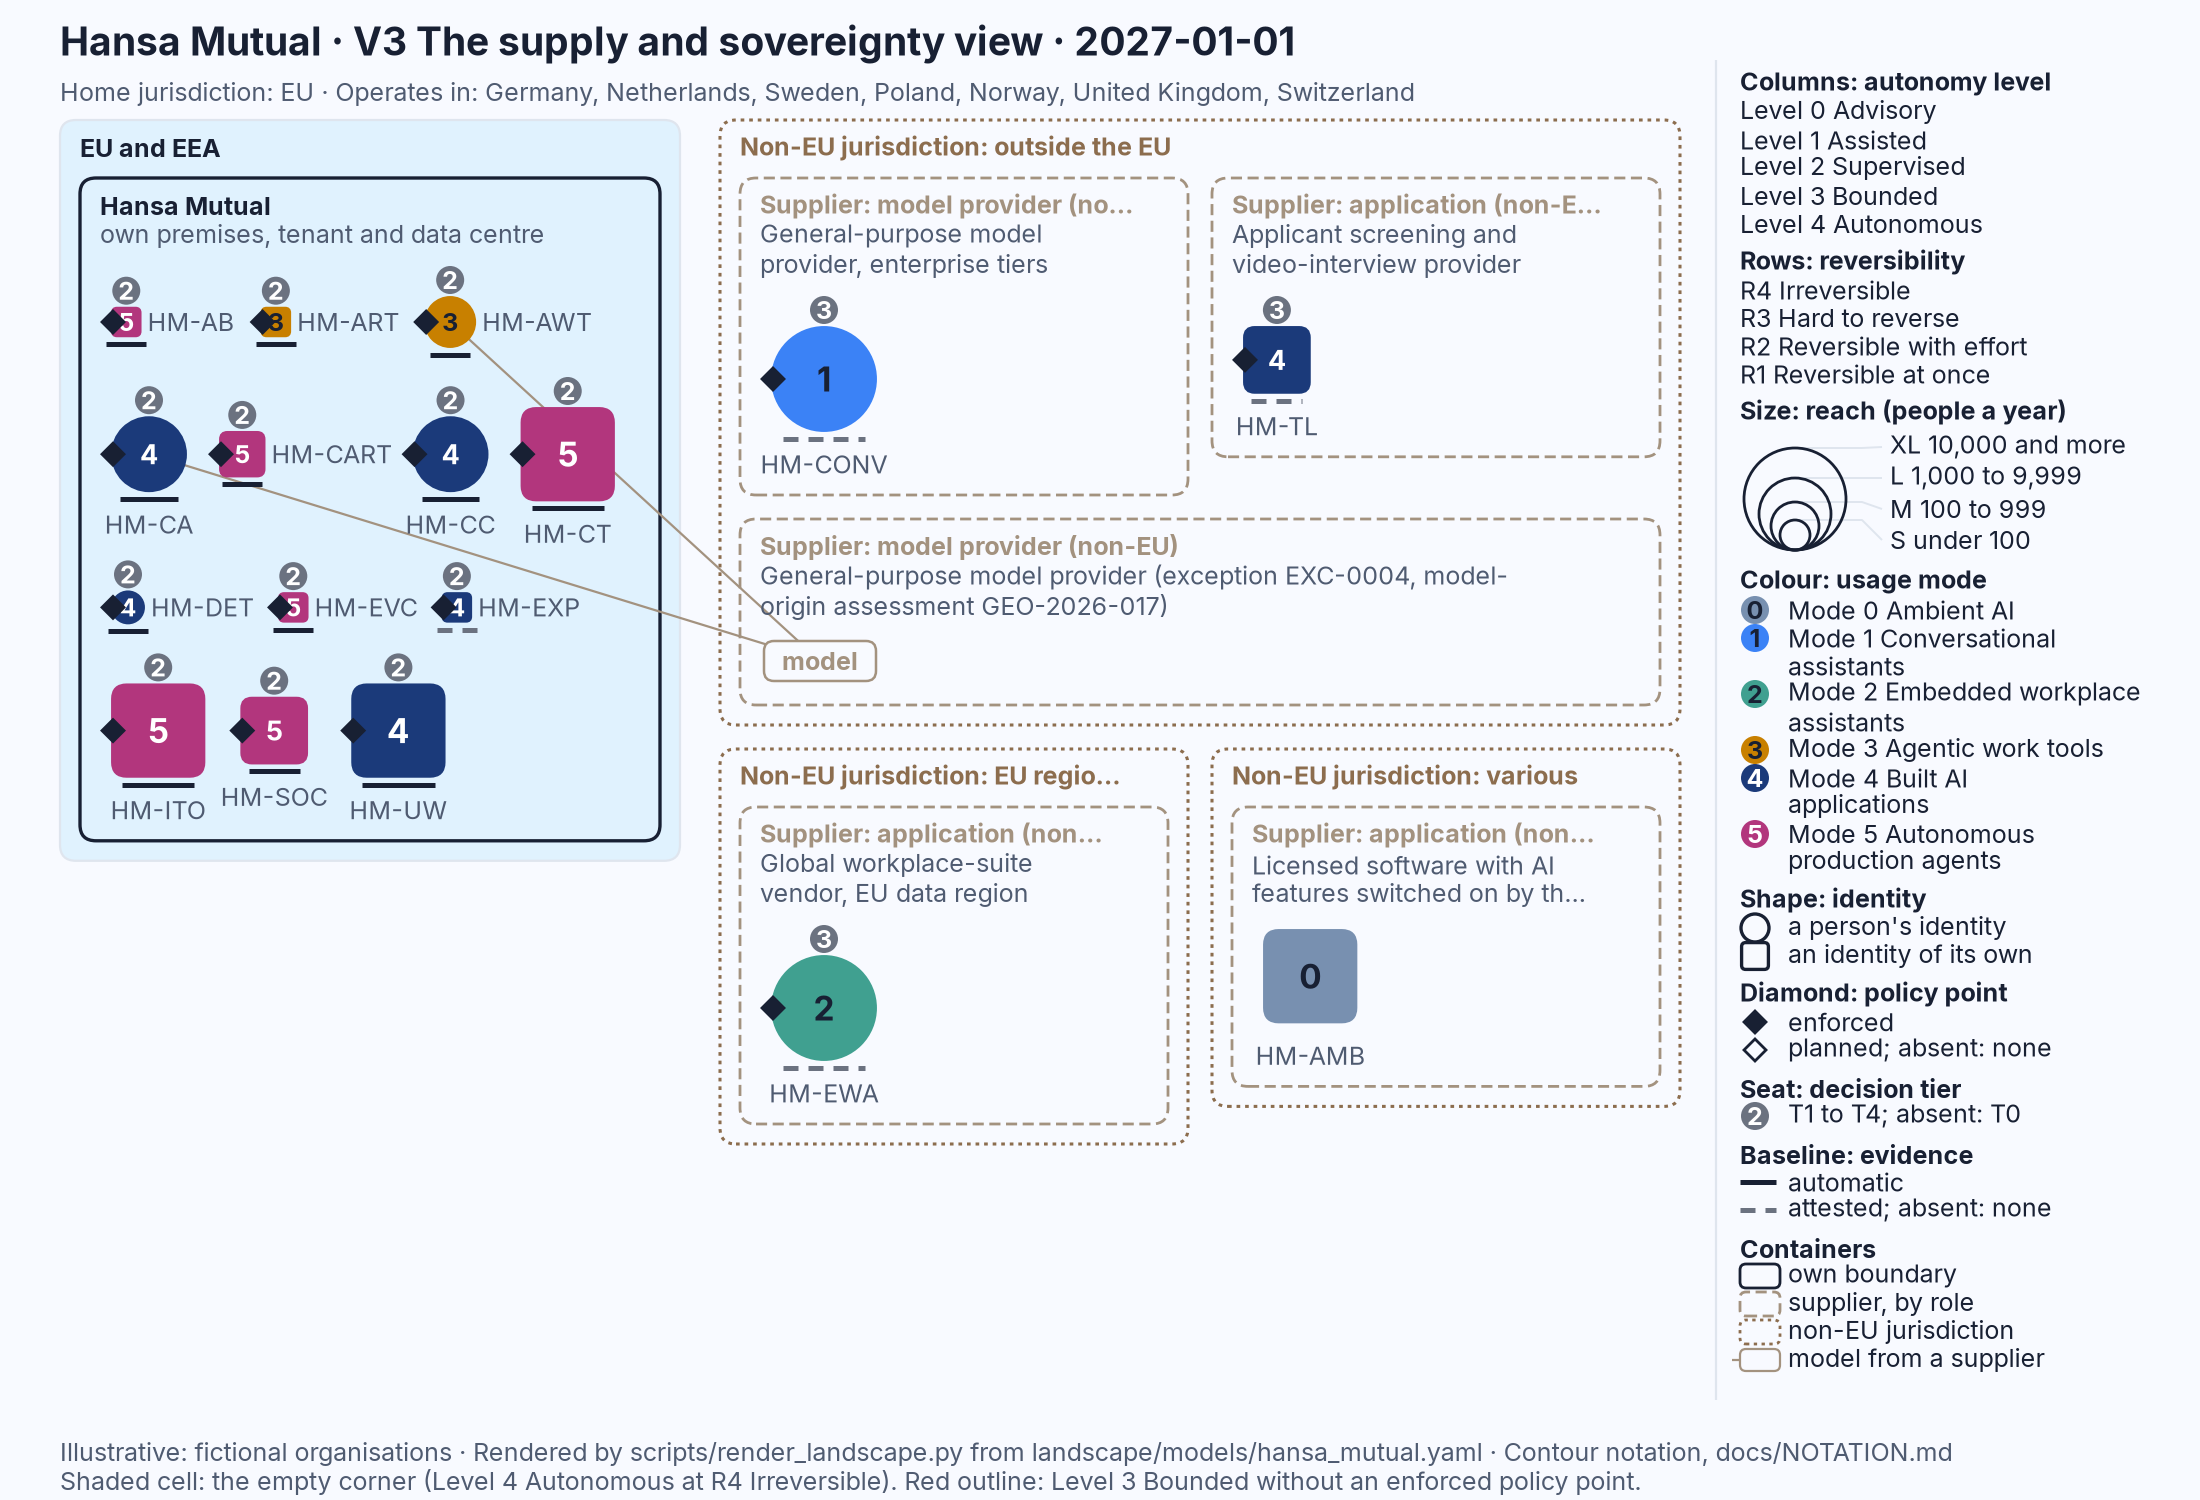
Figure 4.3: Hansa Mutual's landscape at the start of 2027, V3 The supply and sovereignty view: the same seventeen marks placed by boundary, supplier role and jurisdiction. Illustrative: rendered from landscape/models/hansa_mutual.yaml.
In Figure 4.3 the light area on the left is the EU and the EEA, and the solid rounded rectangle inside it is Hansa Mutual's own boundary, holding thirteen of the seventeen marks, the agents among them. To the right, inside dotted containers for jurisdictions outside the EU, four dashed supplier containers hold the conversational assistants, the recruitment screening system, the embedded assistants and the licensed software nobody chose. One more holds no mark but a chip labelled "model", joined by thin lines to two marks inside the group's own boundary that take their model from a provider outside the EU under a recorded exception. The chip separates "who runs this" from "whose model is this".
V4 The decision-rights view has one row per unit, sorted by level. A bar runs from Level 0 Advisory to the unit's ceiling; thin bars under it show the level per class of action; the seat and the diamond sit at the ceiling; and the Level 4 Autonomous column is shaded for units at R3 and R4.
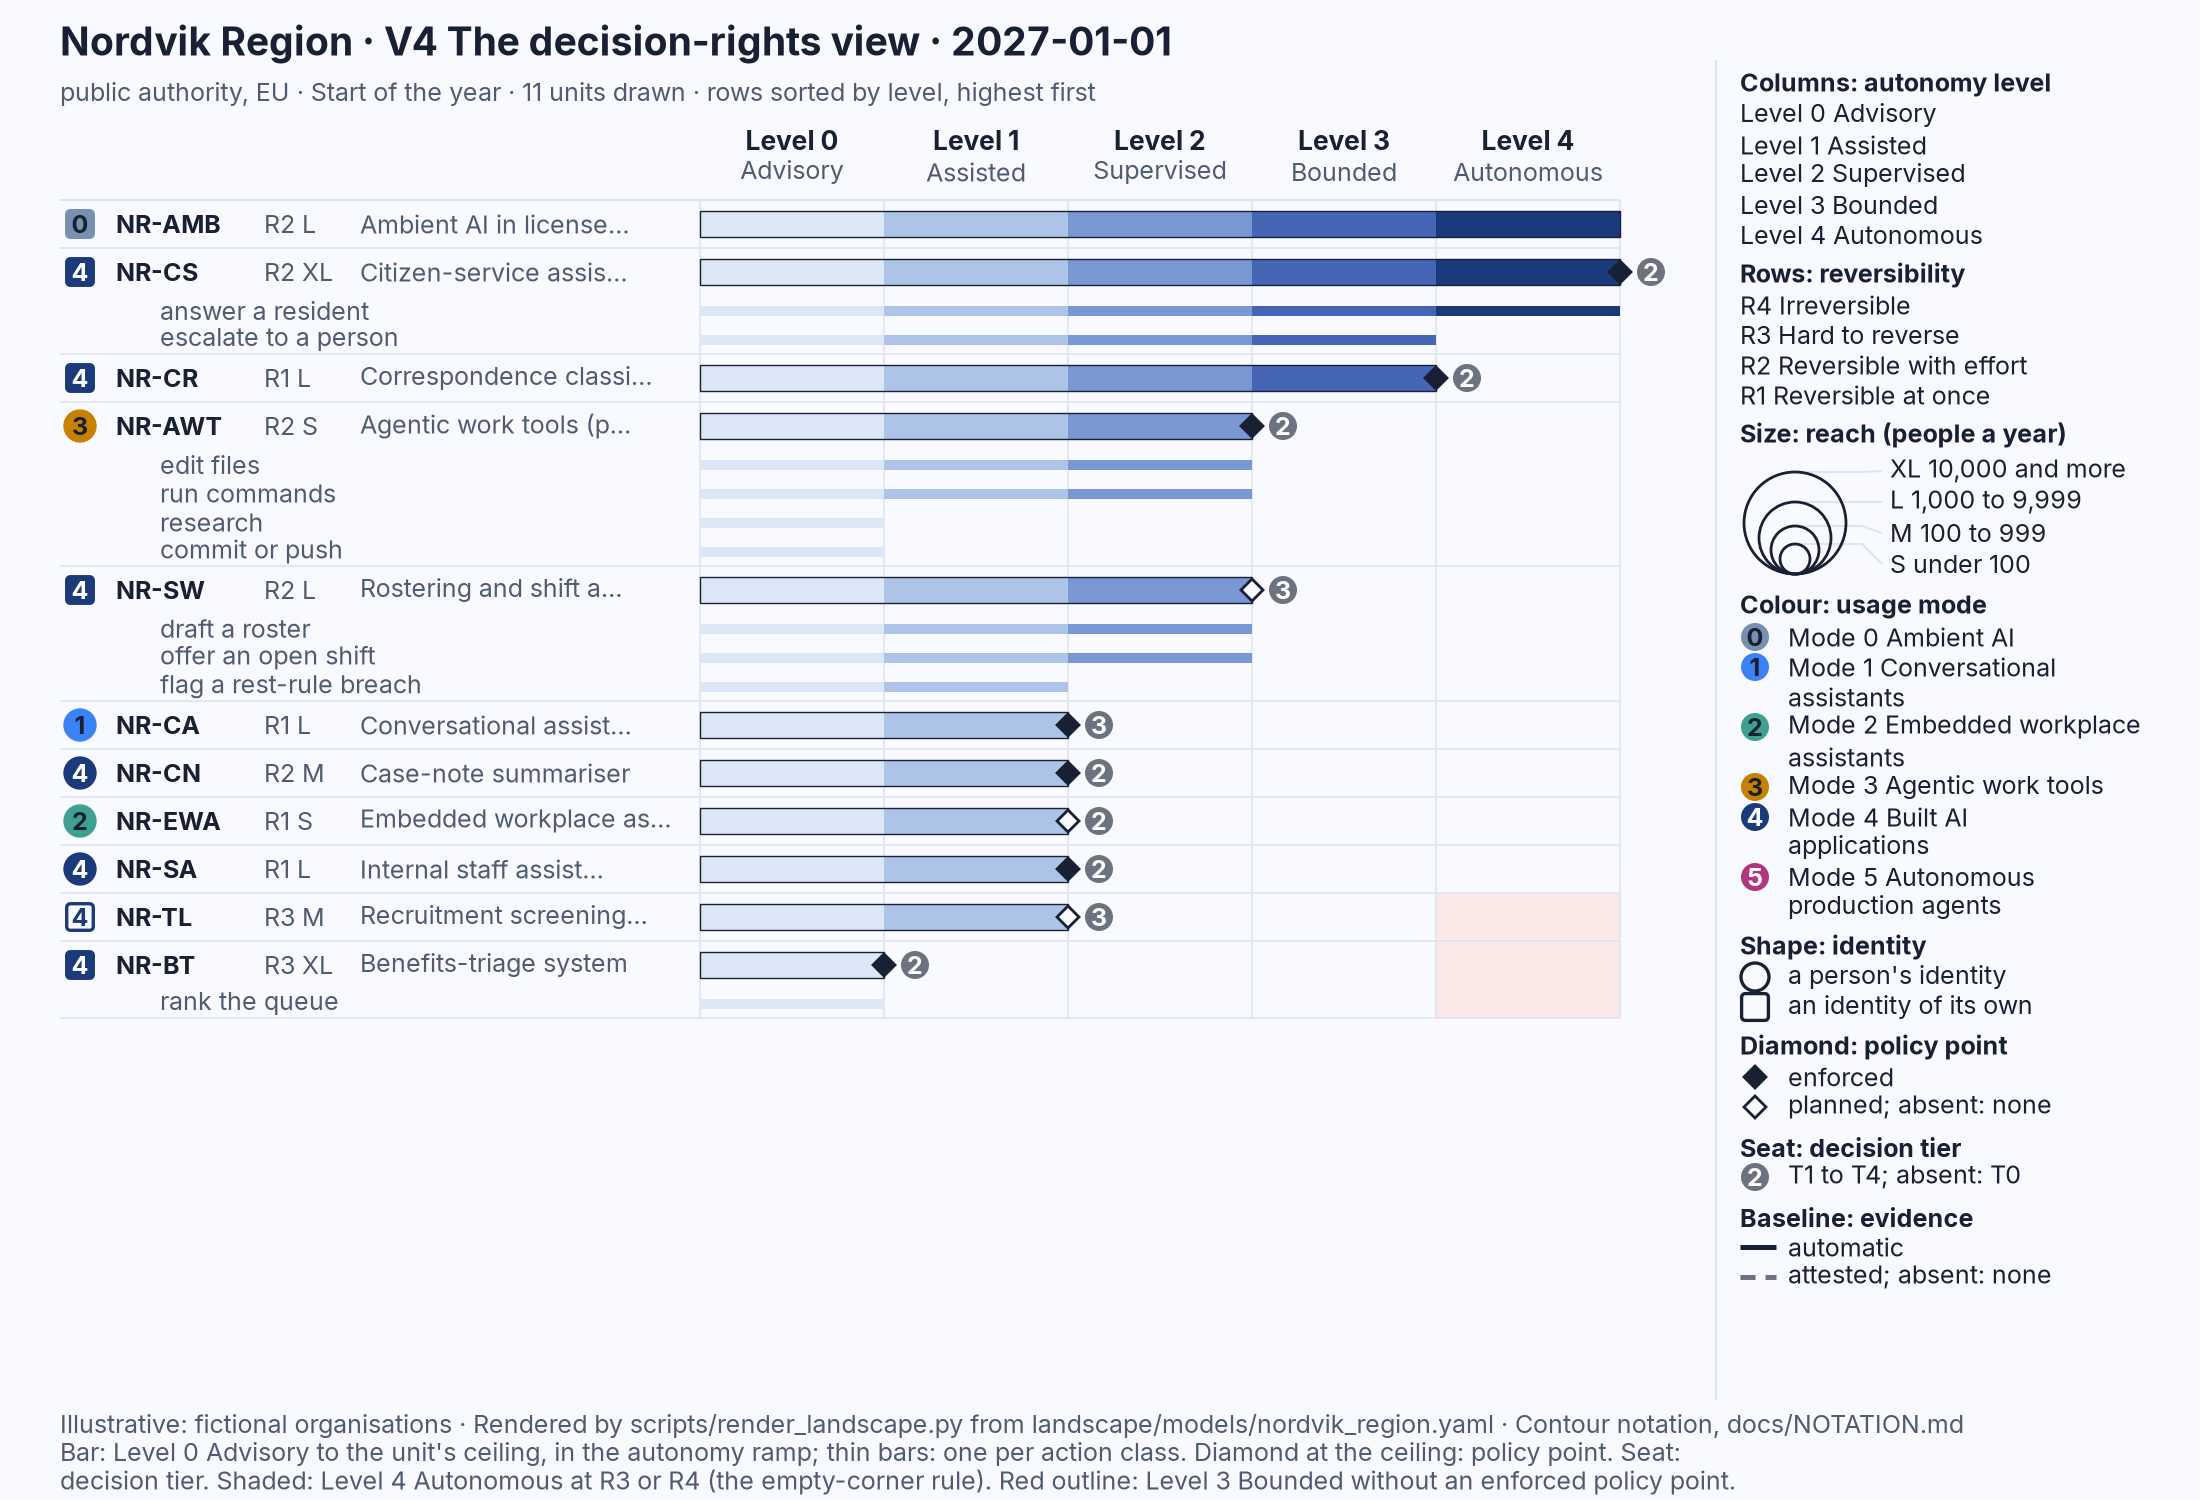
Figure 4.4: Nordvik Region's landscape at the start of 2027, V4 The decision-rights view: each unit's ceiling, its levels per action class, and who holds the decision at the ceiling. Illustrative: rendered from landscape/models/nordvik_region.yaml.
Figure 4.4 shows what V1 cannot. The top row, NR-AMB, runs to Level 4 Autonomous and ends with no diamond and no seat. The second, NR-CS, also reaches Level 4 but ends with a filled diamond and a seat, and its thin bars say why: answering a resident reaches Level 4, handing a question to a person Level 3. The row to find is NR-SW, the rostering system. Its ceiling is Level 2 Supervised, marked by a hollow diamond, because its policy point is planned, and a seat carrying 3, the HR director. Its thin bars, drafting a roster and offering an open shift at Level 2 and flagging a rest-rule breach at Level 1, all stay at or under the ceiling. In the scenario of Chapter 18 one class of open-shift offers moves to Level 3 in March 2027, and the unit's ceiling moves with it. Chapter 17 reads this view in full.
A thin bar can pass the ceiling only for a read-only action. Hansa Mutual's decision-rights view, Figure 3.4, shows it: HM-SOC isolates a workstation and revokes a session at Level 3, so its ceiling is Level 3 Bounded, yet its thin bar "enrich an alert" runs to Level 4. That is the read-only rule at work, and the bar records it: autonomy over a read changes nothing that would need undoing.
V5 The evidence view has one row per unit and columns for the kinds of evidence: logs, tests and evaluations, gates and policies as code, attestations, and none. A filled cell is automatic evidence, a hatched cell attested, and a unit with nothing carries the word "none" in red.
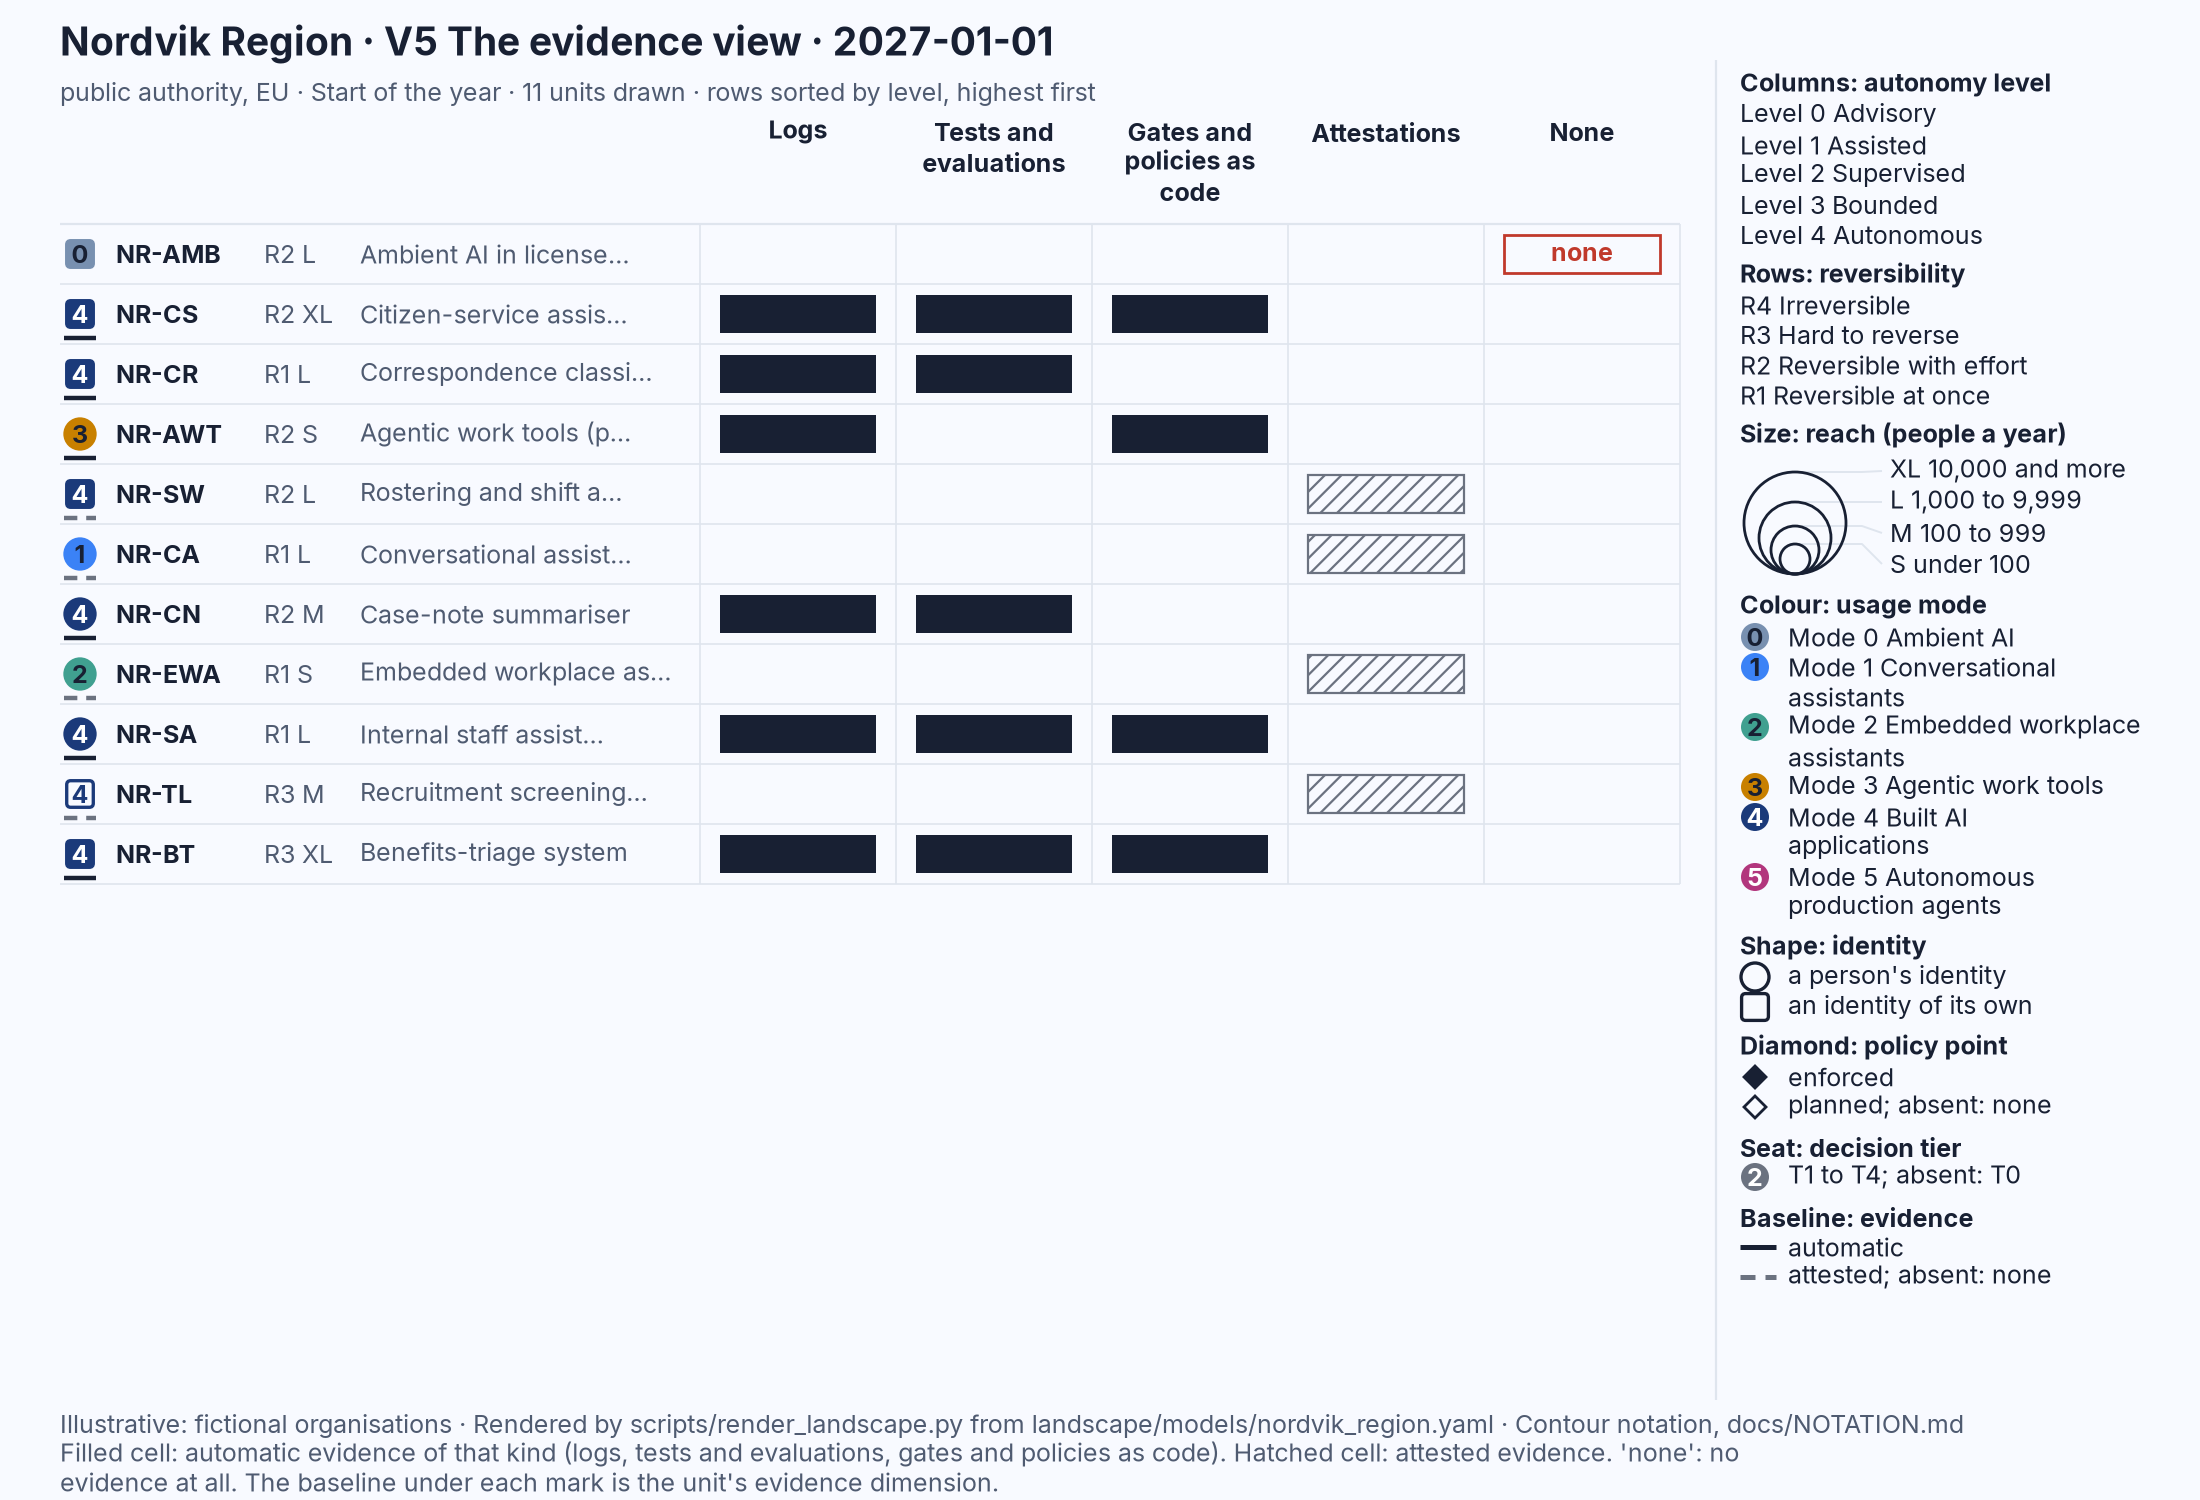
Figure 4.5: Nordvik Region's landscape at the start of 2027, V5 The evidence view: for each unit, which kinds of proof exist and whether the system produces them or a person declares them. Illustrative: rendered from landscape/models/nordvik_region.yaml.
In Figure 4.5 three units fill three cells each; four rows have one hatched cell under attestations. The top row, the ambient AI, has the red "none".
V6 The comparison view places two V1 views side by side with the shared legend and the summary strips.
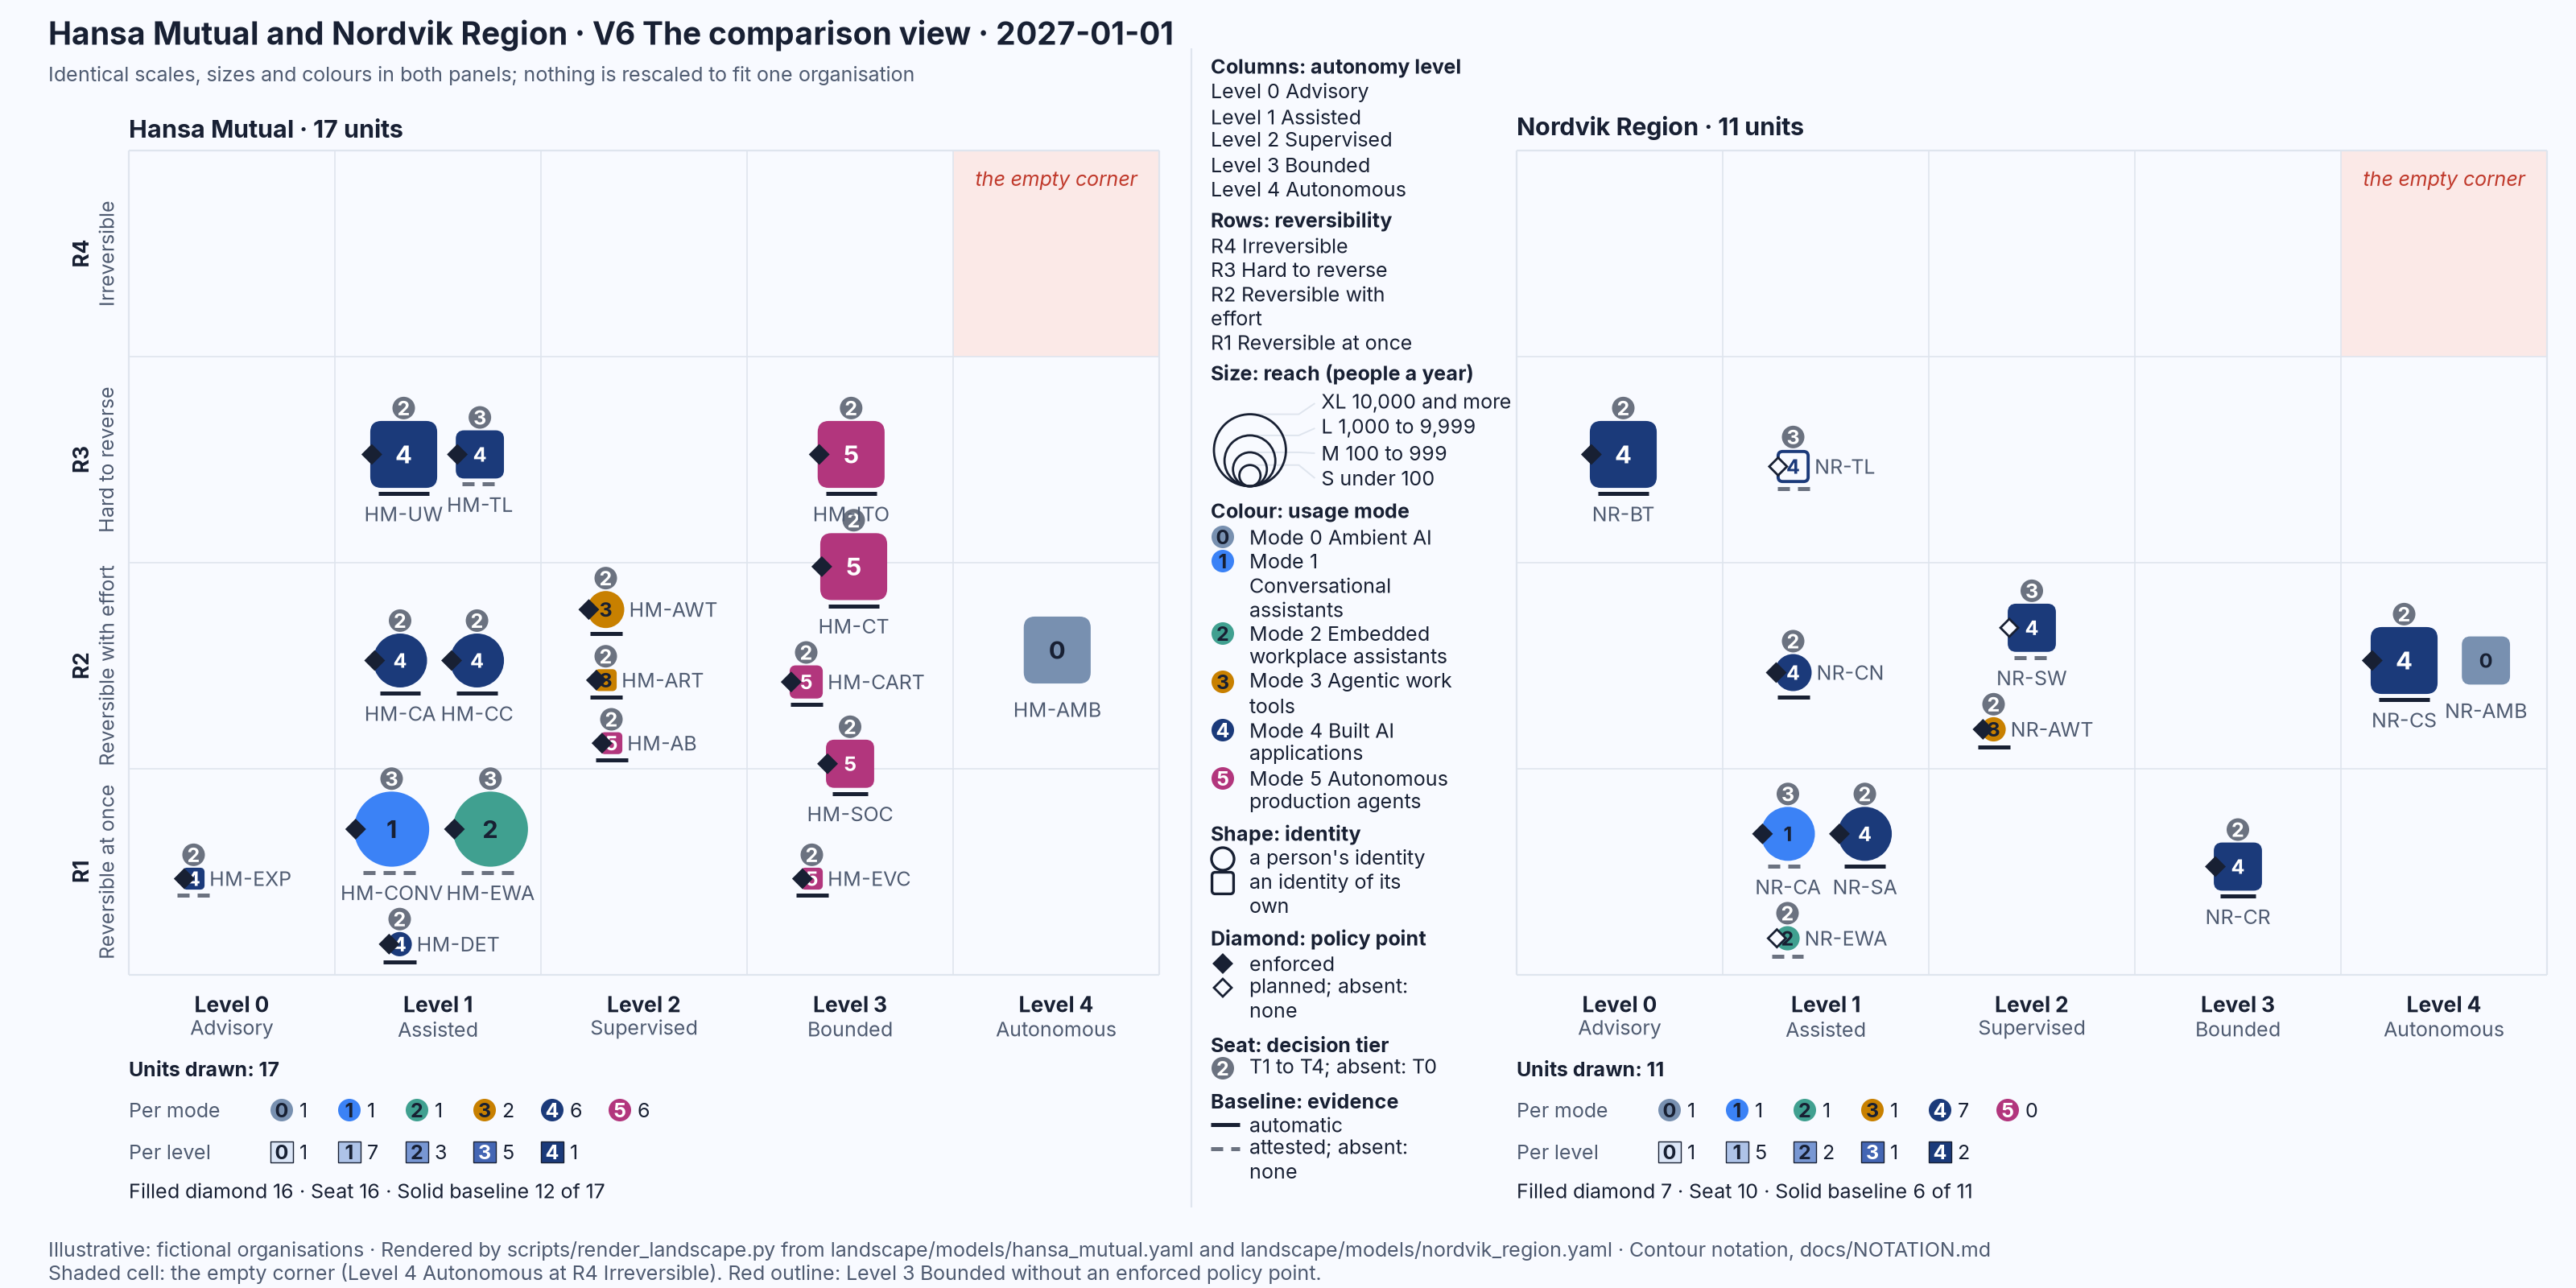
Figure 4.6: Hansa Mutual and Nordvik Region at the start of 2027, V6 The comparison view: the two landscapes at identical scales with counts per mode, per level, and of filled diamonds, seats and solid baselines. Illustrative: rendered from landscape/models/hansa_mutual.yaml and landscape/models/nordvik_region.yaml.
The summary strips under Figure 4.6 put counts to what the eye saw: a filled diamond on sixteen of Hansa Mutual's seventeen marks and a solid baseline on twelve; a filled diamond on seven of Nordvik Region's eleven and a solid baseline on six. The view does not say which organisation is better governed, and the notation has no way to say it; it shows that an insurer that builds and a public authority that buys have landscapes of different shape. Chapter 18 returns to it at the end of the scenario's year.
The legend
Every view carries the same legend in its margin, in the same order: columns and rows; the four sizes; the six mode colours with their numbers; the two shapes; the diamond; the seat; the baseline; and, where the view uses them, the container borders and the trail. One legend, in one order, in every figure, is the smallest of the notation's decisions and the one I would defend first.
What is deliberately left out
The notation does not draw model names, versions or vendors; they belong to the supply view as roles and to the inventory as text, and the usage mode, not the model, sets the risk. It does not draw accuracy, benchmark or cost figures. It does not draw the components, data flows and interfaces of a system; architecture diagrams do that. It does not draw organisation charts; the seat says who decides, not who reports to whom. It does not draw the legal classification of a unit, which follows from the use and the law. And it draws no judgement of value. A landscape is a picture of what is, drawn so that the reader can judge.
Reading a landscape in thirty seconds
- Look at the empty corner first. Anything there is the first question to ask.
- Count the squares at Level 3 Bounded and above. Those are the agents. Each should have a filled diamond and a seat.
- Find the marks without a seat. Nobody decides about those.
- Find the dashed baselines at R3 Hard to reverse. Those are the controls whose proof is a promise.
- Look at the colours. Mode 0 Ambient AI marks without a seat are AI nobody chose; Mode 5 Autonomous production agents marks are AI that acts.
- Then, and only then, read the names.
Thirty seconds is the design aim of the routine, not a measured result. Applied to Figure 4.1, the six steps give the regional director five observations without reading a name. The empty corner is empty. Three squares stand at Level 3 Bounded or above, and two of them carry a filled diamond and a seat. One mark has no seat. The one dashed baseline at R3 belongs to the paused recruitment pilot. And there is no plum, while one grey-blue square stands at Level 4. Each is a question to take into the next meeting.
Pen and paper
Contour is designed to be drawn by hand. Draw the grid and shade the top-right cell. For each AI use, place a circle or a rounded square in its cell, at one of four sizes, write the mode's number inside it, add a diamond on the left edge if a policy point exists, a small circle above it with the decision tier if someone is named, and a solid or dashed line beneath it. Appendix A carries the reference card, the seven dimensions, the scales and the legend on one page, and Appendix B one hand-drawing page per view.
Author's note needed: a paragraph on the first time the author drew the grid on a whiteboard in a real meeting, what the people in the room saw first and which mark changed the conversation; it would sit here, before the model fragment, and show that the sketch works before the renderer does.
What the renderer adds is exactness, not possibility. Every view in this book is produced by scripts/render_landscape.py from a machine-readable model, one YAML file per organisation, with the seven dimensions of every unit, its suppliers and a timeline of changes; nothing is placed by hand. This is an excerpt of the entry behind the largest mark in Figure 4.1, copied from Nordvik Region's model, leaving out its description, dates, hosting, suppliers, registers, action levels and timeline:
- id: NR-BT
  name: Benefits-triage system
  mode: 4
  identity: own
  level: 0
  reversibility: R3
  reach: XL
  policy_point: enforced
  decision_tier: T2
  decision_holder: Head of Benefits Unit (system owner)
  evidence: automatic
  evidence_kinds: [logs, tests, gates]
Every line is one thing the reader saw in the mark: identity: own is the square, level: 0 the column, reversibility: R3 the row, policy_point: enforced the filled diamond. Appendix A lists the full fields, and Chapter 14 shows how to fill them. The model is landscape as code: versioned, tested against a schema and rendered rather than drawn.
Summary
Contour draws one AI use as one mark with seven dimensions and nothing else: autonomy level as the column, reversibility tier as the row, reach as the size, usage mode as the colour, identity as the shape, control as a diamond and a seat, and evidence as a baseline. The modes and the levels are adopted from AI Governance, Chapter 2, and AI Red Team, Chapter 6, by their exact names; the reversibility tiers, the reach classes counted in people, the decision tiers and the kinds of evidence are this book's own.
Each dimension answers a question that decides what an AI use can do: the mode, not the model, sets the governance; the line between Level 2 Supervised and Level 3 Bounded is the one that matters; autonomy is matched to reversibility, which the empty corner draws; a limit without a policy point outside the model is a hope; every consequence has a named decider; and evidence is what a system produces, attestation what a person declares.
Three frames arrange the marks and six views are each defined once and rendered from a committed model. The notation leaves out model names, costs, components, organisation charts, legal classes and every judgement of value, and it is read in a fixed order, the empty corner first and the names last.
Part II turns from the picture to the people who look at it. Each of the next nine chapters names one instinct that makes people misread this landscape, shows it in public data, corrects the picture with a view in this notation, and gives one rule of thumb. The first is the box instinct: the habit of seeing AI as one thing.
Sources
- Nordqvist, G. (2026). AI Governance: Governing Artificial Intelligence in European Enterprises and Public Authorities. aig.geon.se. (2, Nordqvist, 2026)
- Nordqvist, G. (2026). AI Platform and Security: Building and Securing AI Platforms in European Enterprises and Public Authorities. aips.geon.se. (3, Nordqvist, 2026)
- Nordqvist, G. (2026). AI Red Team: AI as an Active Part of Cyber Defence in European Enterprises and Public Authorities. aired.geon.se. (4, Nordqvist, 2026)
- Nordqvist, G. (2026). AI Boss: When Artificial Intelligence Manages People in European Enterprises and Public Authorities. aiboss.geon.se. (7, Nordqvist, 2026)
- Rosling, H., Rosling, O. and Rosling Rönnlund, A. (2018). Factfulness. London: Sceptre. (8, Rosling et al., 2018)