The Size Instinct: Numbers Without Denominators
Four numbers, each from a public source, laid out as a briefing might lay them out on its first page. The European Union Agency for Cybersecurity analysed 4,875 cyber incidents in the twelve months to June 2025, and 11,079 the year before (38, ENISA, 2025) (37, ENISA, 2024). The AI Incident Database held 1,786 records of AI systems that caused or nearly caused harm at the start of November 2026, 463 of them dated 2025 (35, Responsible AI Collaborative, 2026). Two thirds of respondents to a Eurobarometer survey in the spring of 2024, 66 per cent, agreed with the statement that "due to the use of robots and artificial intelligence, more jobs will disappear than new jobs will be created" (29, European Commission, 2025). And the Union employed 10.45 million ICT specialists in 2025, the workers whose main job is to develop, operate or maintain information and communications technology systems (12, Eurostat, 2026).
Every one of these numbers is true, and each has a source that stands behind it. Read together, they produce a feeling rather than a picture: attacks in their thousands, harms in their hundreds, jobs under threat, a vast technical workforce. The feeling is of scale.
Now read the same numbers with the piece the briefing left off. The 2025 ENISA report states that it used the agency's updated methodology of August 2025, so the later count is no baseline for the earlier one, and about 76.7 per cent of its incidents were denial-of-service attacks, which ENISA describes as having very low impact overall (38, ENISA, 2025). The AI Incident Database counts what the press reported and volunteers submitted (17, Maslej et al., 2025). The two thirds were giving an opinion about the future, not reporting a job lost; in the same survey, 66 per cent of those in work said the newest digital technologies had a positive effect on their own employment (29, European Commission, 2025). And the 10.45 million specialists were 5.0 per cent of everyone in work (12, Eurostat, 2026).
None of the numbers was wrong. Each was missing the thing it should have been divided by, or compared with, or the definition that gave it its size. This chapter is about that missing piece, the denominator, and about the one place in the notation where size is drawn.
The questions
Three questions of the test in Chapter 1 belong to this chapter: the same kind of question asked three times.
Question 1 asked: "In 2025, what share of enterprises in the EU with at least ten employees used at least one artificial-intelligence technology?" The options were about 20, 45 and 70 per cent. The measured answer is 19.95 per cent, from Eurostat's survey of ICT usage in enterprises, which asks a sample of enterprises, 157,000 of about 1.53 million in 2025, whether they use any of a listed set of AI technologies (9, Eurostat, 2026).
Question 2 asked: "Among large enterprises in the EU (250 employees or more), what share used at least one AI technology in 2025?" The options were about 25, 40 and 55 per cent. The measured answer is 55.03 per cent, from the same survey and question, counted over large enterprises only (9, Eurostat, 2026).
Question 8 asked: "ICT specialists made up what share of total employment in the EU in 2025?" The options were about 5, 12 and 20 per cent. The measured answer is 5.0 per cent, from Eurostat's labour force survey, which counts people by occupation (12, Eurostat, 2026).
All three are self-test questions: no published survey that I know of asked the public to guess these shares, so there is no "respondents answered" to set beside the measured answer. Each has a large number behind it that is easier to remember than the share: by my estimate about 305,000 enterprises using AI (19.95 per cent of the roughly 1.53 million enterprises Eurostat gives for the 2025 survey, on the assumption that this is the population the percentage describes) (9, Eurostat, 2026), and 10.45 million ICT specialists (12, Eurostat, 2026).
The instinct
The size instinct is the habit of being impressed by a large number on its own, without the denominator, the base rate or the comparison that would tell us whether it is large. Hans Rosling described the instinct in Factfulness and gave the rule that answers it: a lonely number should make you suspicious, and the cure is to divide (8, Rosling et al., 2018). This book applies the method to a different landscape.
The instinct is not a defect. A council that hears of a thousand complaints looks for a fault, and counting is how we notice that something has grown. Most of the time the reaction to size serves us.
It misleads in this landscape for three reasons particular to it. The first is that the numbers arrive without denominators because the denominators are hard to produce. A security product can count the requests it blocked; nobody counts the requests that were made. An incident database can count the harms that reached the press; nobody counts the deployments that did not. The counts that are easy to make are counts of events.
The second is that the denominators grow at the same time as the numerators. When more enterprises use AI every year, more incidents involving AI follow even if nothing about AI has become more dangerous, as more cars on the road produce more accidents at an unchanged rate. A count of incidents over rising adoption measures adoption as much as harm.
The third is that the same fact can be counted against several denominators, and each gives a different number. One in five enterprises uses AI; more than one in two large enterprises does; one in six small ones does. These are three answers to one question, and the instinct takes whichever it met first as the size of the thing.
Author's note needed: A short passage, about a paragraph, from the author's own practice would carry this section: a board or steering group shown a transaction count (requests, documents, tokens, blocked attacks) as the measure of an AI programme's size or of a threat, and the moment when someone asked how many people that was. It should show the instinct at work in capable people, and sit here, before the evidence.
The same instinct works inside an organisation. Each delegation to an agent looks small when it is measured by what it does, routing a claim or refreshing an evidence link, and large when it is measured by how many people it touches in a year.
The evidence
A count and a share, side by side
Figure 10.1 shows the same fact twice. The left panel is the number of ICT specialists in employment in the EU27, in thousands of persons, from 2011 to 2025; the right panel is the same people as a percentage of total employment (12, Eurostat, 2026).
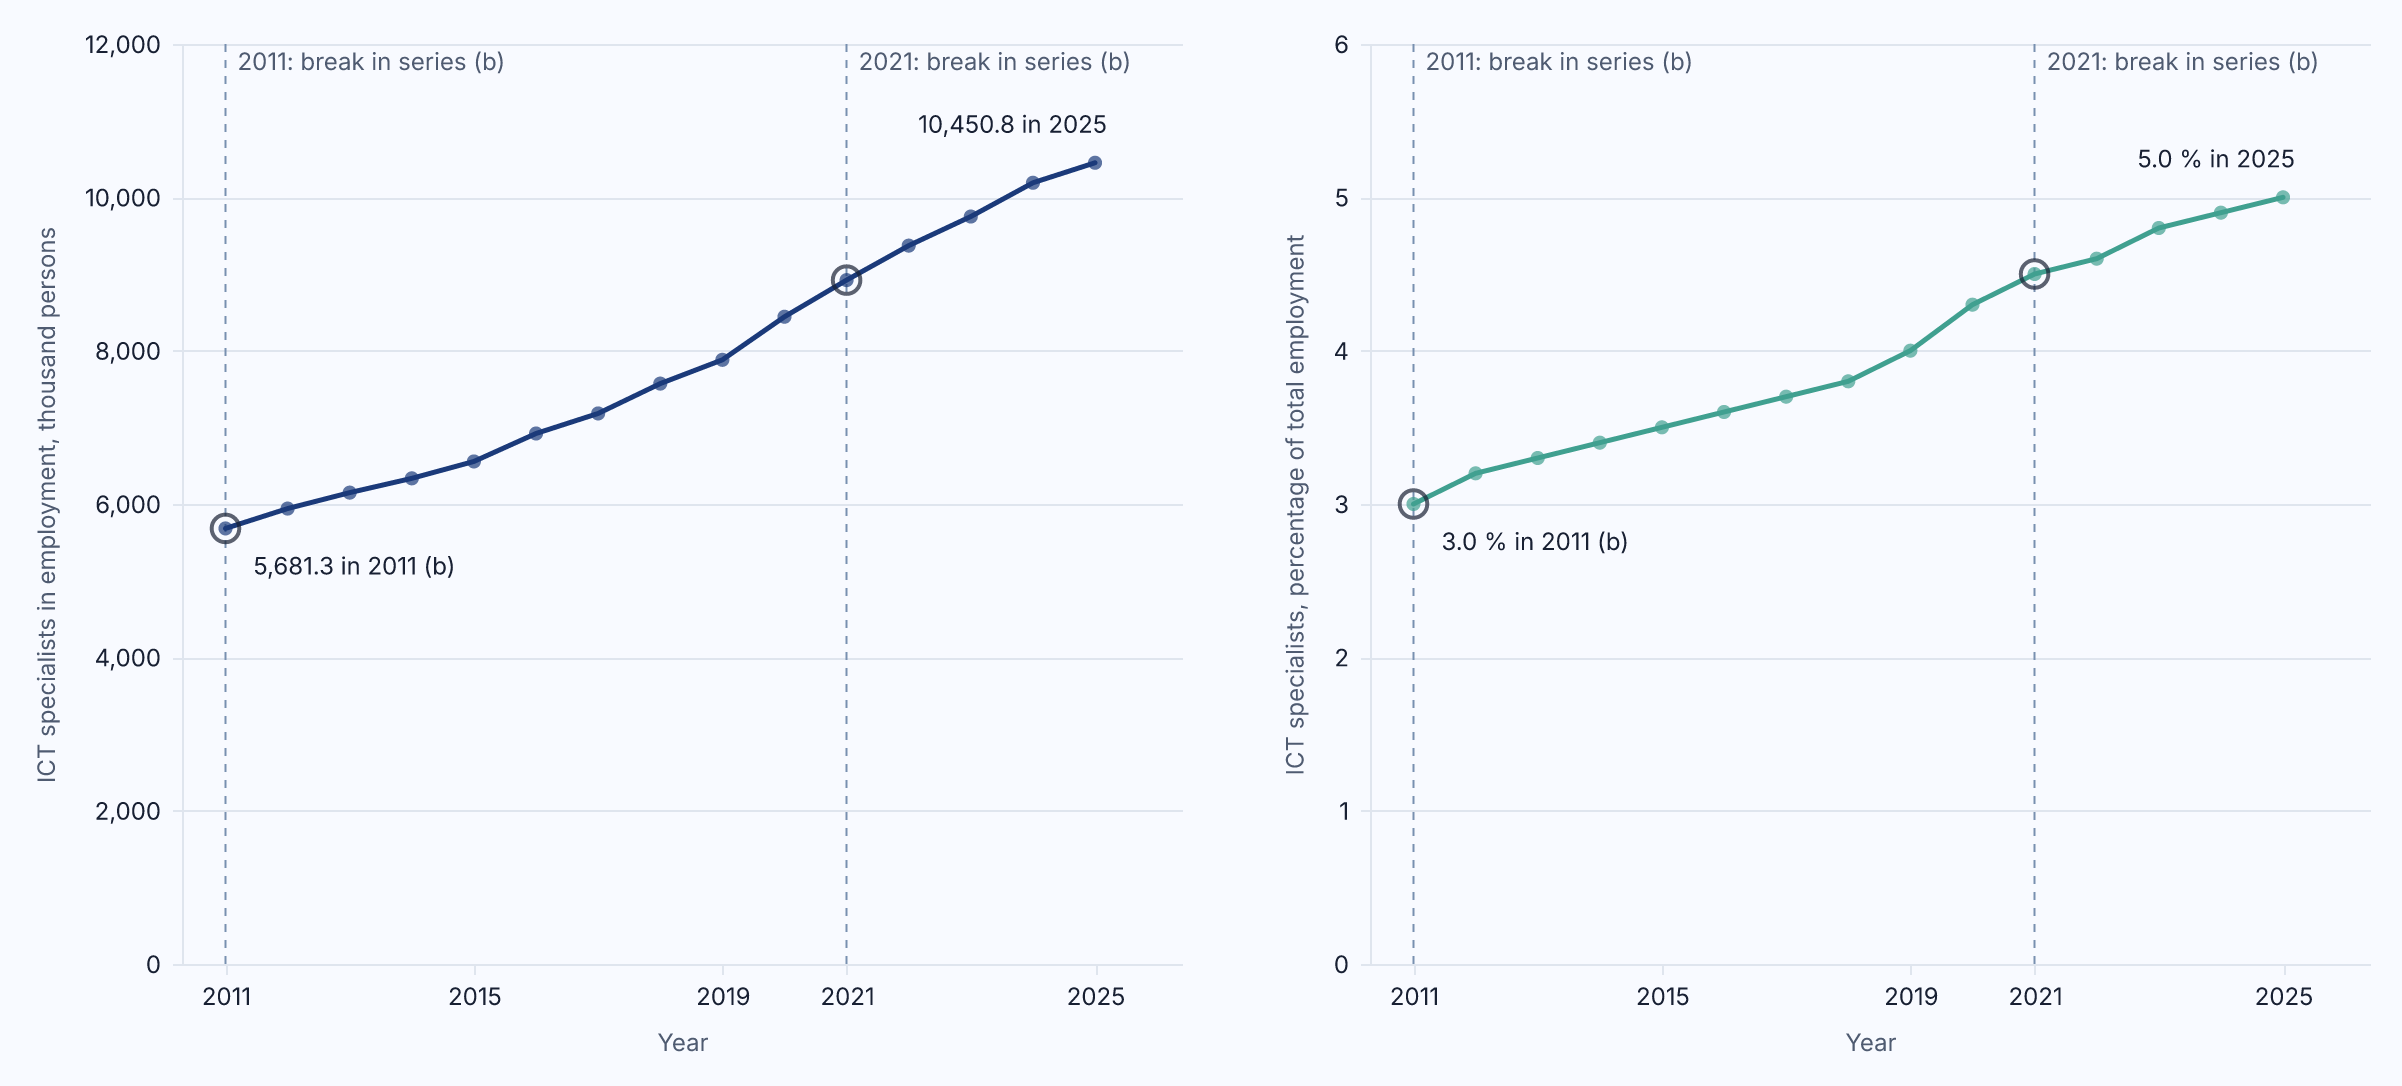
Figure 10.1: Employed ICT specialists in the EU27, 2011 to 2025, as thousands of persons (left) and as a percentage of total employment (right); the 2011 and 2021 values carry a break in series and every EU27 value is an estimate aggregated from national labour force surveys. Source: Eurostat, isoc_sks_itspt (retrieved 2026).
The left panel tells a story of growth: from 5,681.3 thousand in 2011 to 10,450.8 thousand in 2025, a count that nearly doubled (12, Eurostat, 2026). The right panel tells the same story at a different size: from 3.0 per cent of total employment in 2011 to 5.0 per cent in 2025 (12, Eurostat, 2026). Both are true. The count says that the Union has added millions of people to its technical workforce; the share says that nineteen in twenty people in work are still not ICT specialists, and that the whole of the growth moved the share by two percentage points in fourteen years.
The chart carries honesty marks. The series begins in 2011 because the international occupational classification ISCO-08 was introduced that year, and Eurostat warns that comparability with earlier years is "severely impacted"; the 2011 and 2021 values carry breaks in series; and every EU27 value is an estimate aggregated from national surveys (12, Eurostat, 2026). A number that is estimated and broken twice is still the best there is, but not one to quote to a decimal place without saying so.
The count is also the number the Union set itself a target against. The Digital Decade policy programme, the Union's set of digital targets for 2030, includes at least 20 million ICT specialists employed in the Union by 2030 (Decision (EU) 2022/2481, Article 4(1), point (1)(b)) (43, European Union, 2022), and the Commission's dashboard, which draws on the same Eurostat table, shows 10.45 million in 2025 against it (15, European Commission, 2026). That the target exists is observable. The dashboard's own baseline trajectory, projected from past performance, reaches about 12.2 million in 2030 (15, European Commission, 2026): that is the Commission's projection and not an observation, and Chapter 8 shows how much such projections move from one year to the next. Here the comparison works the other way round: 10.45 million sounds large until it is set against 20 million.
One fact, three denominators, and two different facts
Figure 10.2 has two panels because it holds two kinds of statement (15, European Commission, 2026). The upper panel takes one fact, AI in use in enterprises in 2025, and measures it against three denominators. The lower panel shows two different facts about individuals, and they are not a fourth and fifth denominator for the first.
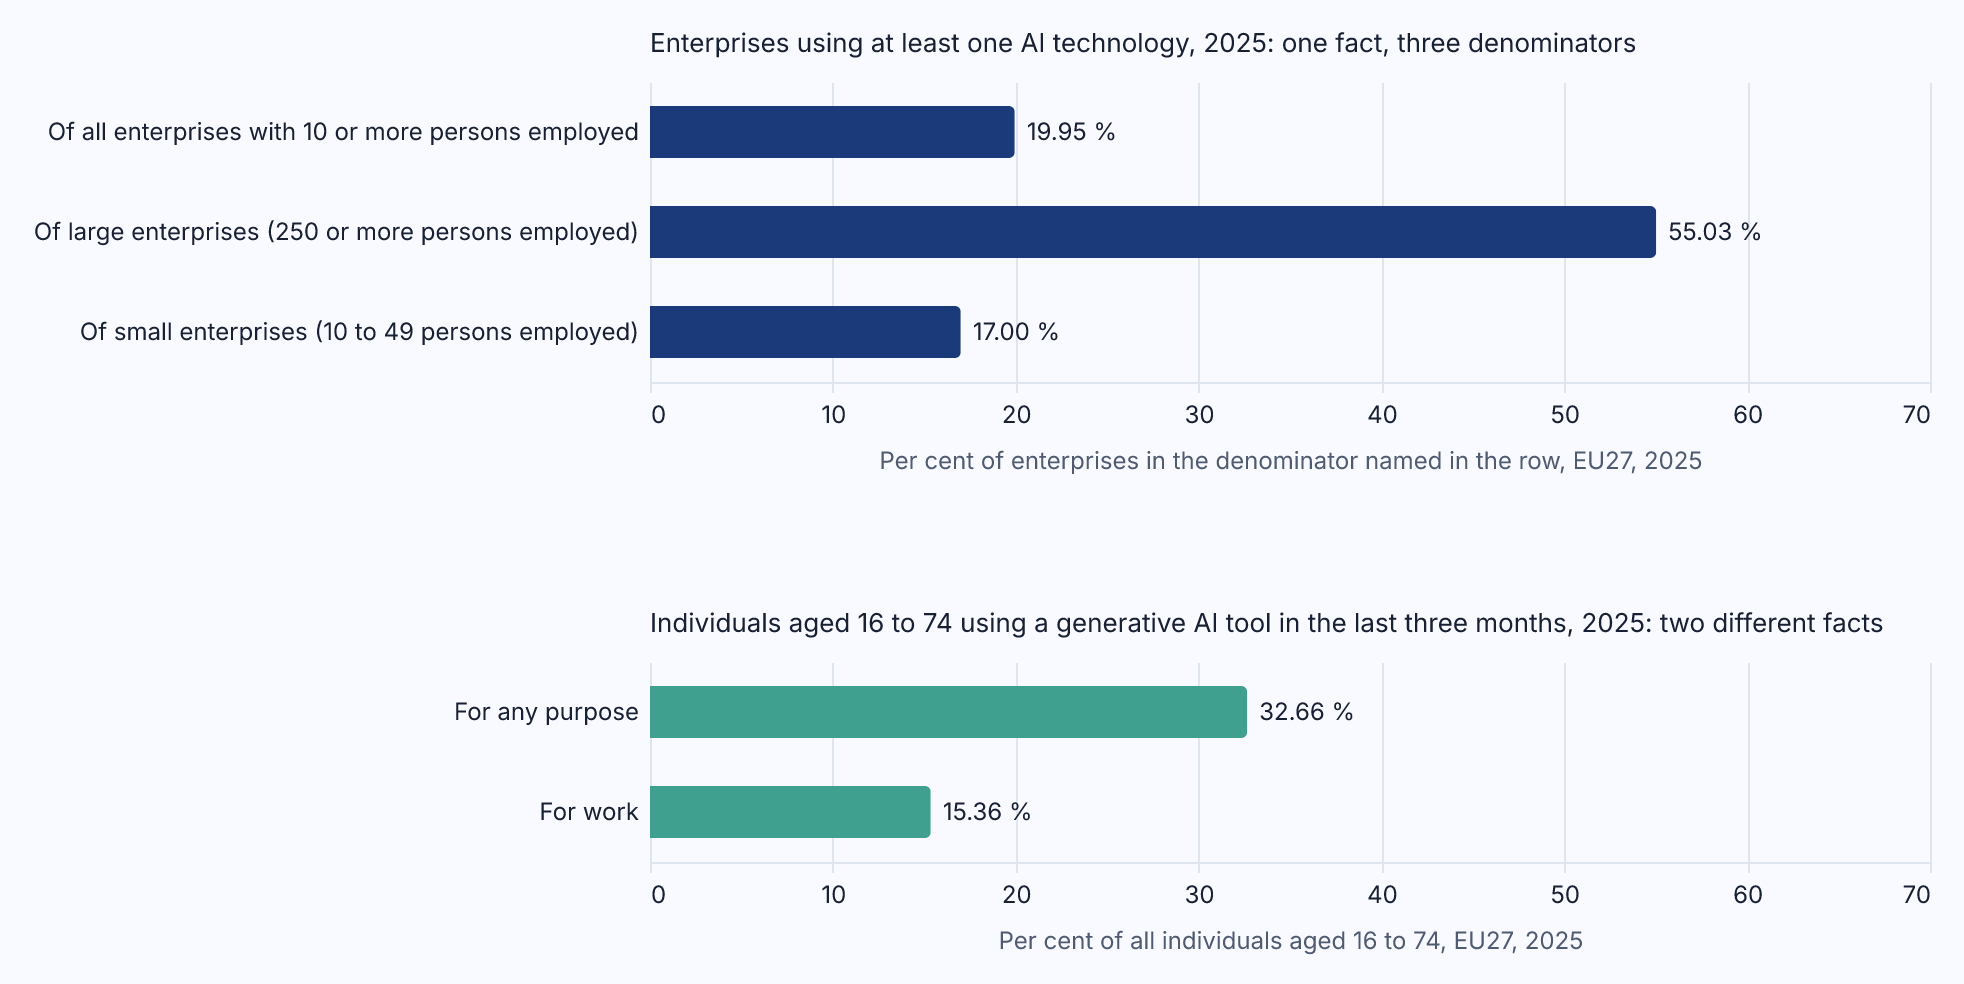
Figure 10.2: AI in use in the EU in 2025, in two panels that are not to be compared. Upper panel: enterprises with ten or more persons employed using at least one AI technology, as a share of all such enterprises, of large enterprises and of small enterprises. Lower panel: individuals aged 16 to 74 who used a generative AI tool in the last three months, as a share of all individuals, for any purpose and for work. Source: European Commission, Digital Decade DESI dashboard, based on Eurostat isoc_eb_ai and isoc_ai_iaiu (retrieved 2026).
In the upper panel, of all enterprises with ten or more persons employed, 19.95 per cent used at least one AI technology in 2025. Of large enterprises, with 250 or more, 55.03 per cent did. Of small enterprises, with 10 to 49, 17.0 per cent did (9, Eurostat, 2026). Each bar answers a question someone might reasonably ask. A policymaker counting enterprises hears one in five. A journalist writing about large companies hears more than one in two, and may write that "most companies now use AI", which is true of large ones and false of the population. The instinct takes whichever bar was shown first as the size of AI in Europe.
The lower panel is a different fact. Of individuals aged 16 to 74, 32.66 per cent had used a generative AI tool in the three months before they were asked, and 15.36 per cent had used one for work, about one in six (14, Eurostat, 2026). These differ from the enterprise bars in the unit counted (people, not enterprises), in the technology (generative AI tools, not a list of eight AI technologies) and in the period (three months). The 15.36 per cent is a share of everyone aged 16 to 74, not of those in work. A reader who sets 32.66 per cent beside 19.95 per cent has compared two things that share only the words "AI" and "use".
The same choice decides Question 10, whose home is Chapter 5: marketing or sales, the most common purpose of AI in enterprises, is 34.7 per cent of AI-using enterprises and 6.92 per cent of all enterprises, and a headline can quote either (9, Eurostat, 2026). A denominator can also change under a number: the 2025 aggregate rests on a longer list of technologies than earlier years, as Chapter 8 shows.
Counting harms without counting deployments
The third piece of evidence is a number this chapter cannot divide, and the gap is the lesson.
The AI Incident Database records incidents in which an AI system is alleged to have caused or nearly caused harm, drawn from press reports and public submissions and accepted by volunteer editors (50, McGregor, 2021). By the year in which the incident is dated, its snapshot of 2 November 2026 holds 91 incidents for 2020, 80 for 2021, 109 for 2022, 179 for 2023, 313 for 2024 and 463 for 2025, with 296 so far for 2026 (35, Responsible AI Collaborative, 2026).
The instinct reads the steep rise as a rise in harm. Three things stand between the count and that reading. First, the count measures reporting and editorial effort as well as events: the Stanford AI Index notes that the number of incidents is continually updated, including for previous years, and it reported 233 incidents for 2024 in the spring of 2025, where the November 2026 snapshot holds 313 (17, Maslej et al., 2025) (35, Responsible AI Collaborative, 2026). Second, the definition sets the size. The OECD's AI Incidents and Hazards Monitor classifies news articles by machine rather than by volunteer editors, and its query for January 2014 to November 2026 returned 18,857 incidents and hazards, more than ten times the Incident Database's total. It also shows them as a share of all AI news events, which has gone down while attention has risen (36, OECD, 2026): a denominator for the news, not for deployments. Neither count is wrong; a reader who quotes one as "the number of AI incidents" has chosen a definition without saying so.
Third, there is no denominator. Between 2024 and 2025 the share of EU enterprises using AI rose from 13.48 to 19.95 per cent (9, Eurostat, 2026), and no public dataset counts deployments in a way that would let the incidents be divided by them. A rate of harm per deployment, per user or per decision cannot be computed from the sources this book has, and I do not compute one. What can be said is narrower: an incident count over rising adoption does not, on its own, show that AI has become more harmful, and anyone who claims that it does owes the reader a denominator.
The cyber numbers of the opening show the same gap. ENISA's 11,079 incidents for July 2023 to June 2024 and its 4,875 for the following year were produced under different versions of ENISA's methodology, so the fall cannot be read as a fall without checking both (37, ENISA, 2024) (38, ENISA, 2025). A number of attacks without the kind, the period and the method behind it is a feeling dressed as a measurement.
Three denominators to ask for
When a number about AI arrives without one, ask for one of three denominators. People: how many people's work or outcomes does this touch? Transactions, documents, requests, tokens and alerts are not people, and the harm and the benefit of an AI use land on people. Deployments: out of how many comparable systems, users or decisions did this happen? Where the population cannot be counted, say so, and treat any rate quoted anyway as speculation. Time: over what period, and against what period before it? Two numbers are comparable only when the thing counted, the way of counting and the period are the same.
The picture corrected
The notation gives size exactly one job. In Contour, the notation of this book (Chapter 4), the area of a mark encodes the unit's reach: the number of people whose work or whose outcomes the unit's actions touch in a year. It is drawn as one of four fixed sizes, S for under 100 people, M for 100 to 999, L for 1,000 to 9,999 and XL for 10,000 and more, and the renderer draws the four radii in the fixed ratio 1 : 1.6 : 2.4 : 3.4, so that a mark cannot be drawn larger to make a point. Reach is a count of people, not of transactions: a unit that handles 400,000 transactions for 12,000 people is XL by people, and it would be XL at four million transactions.
Figure 10.3 is Hansa Mutual's one-page landscape, the view the notation calls V1, at the start of 2027. Hansa Mutual is a fictional insurance group, and the figure is illustrative: it is rendered from the group's landscape model and shows no data.
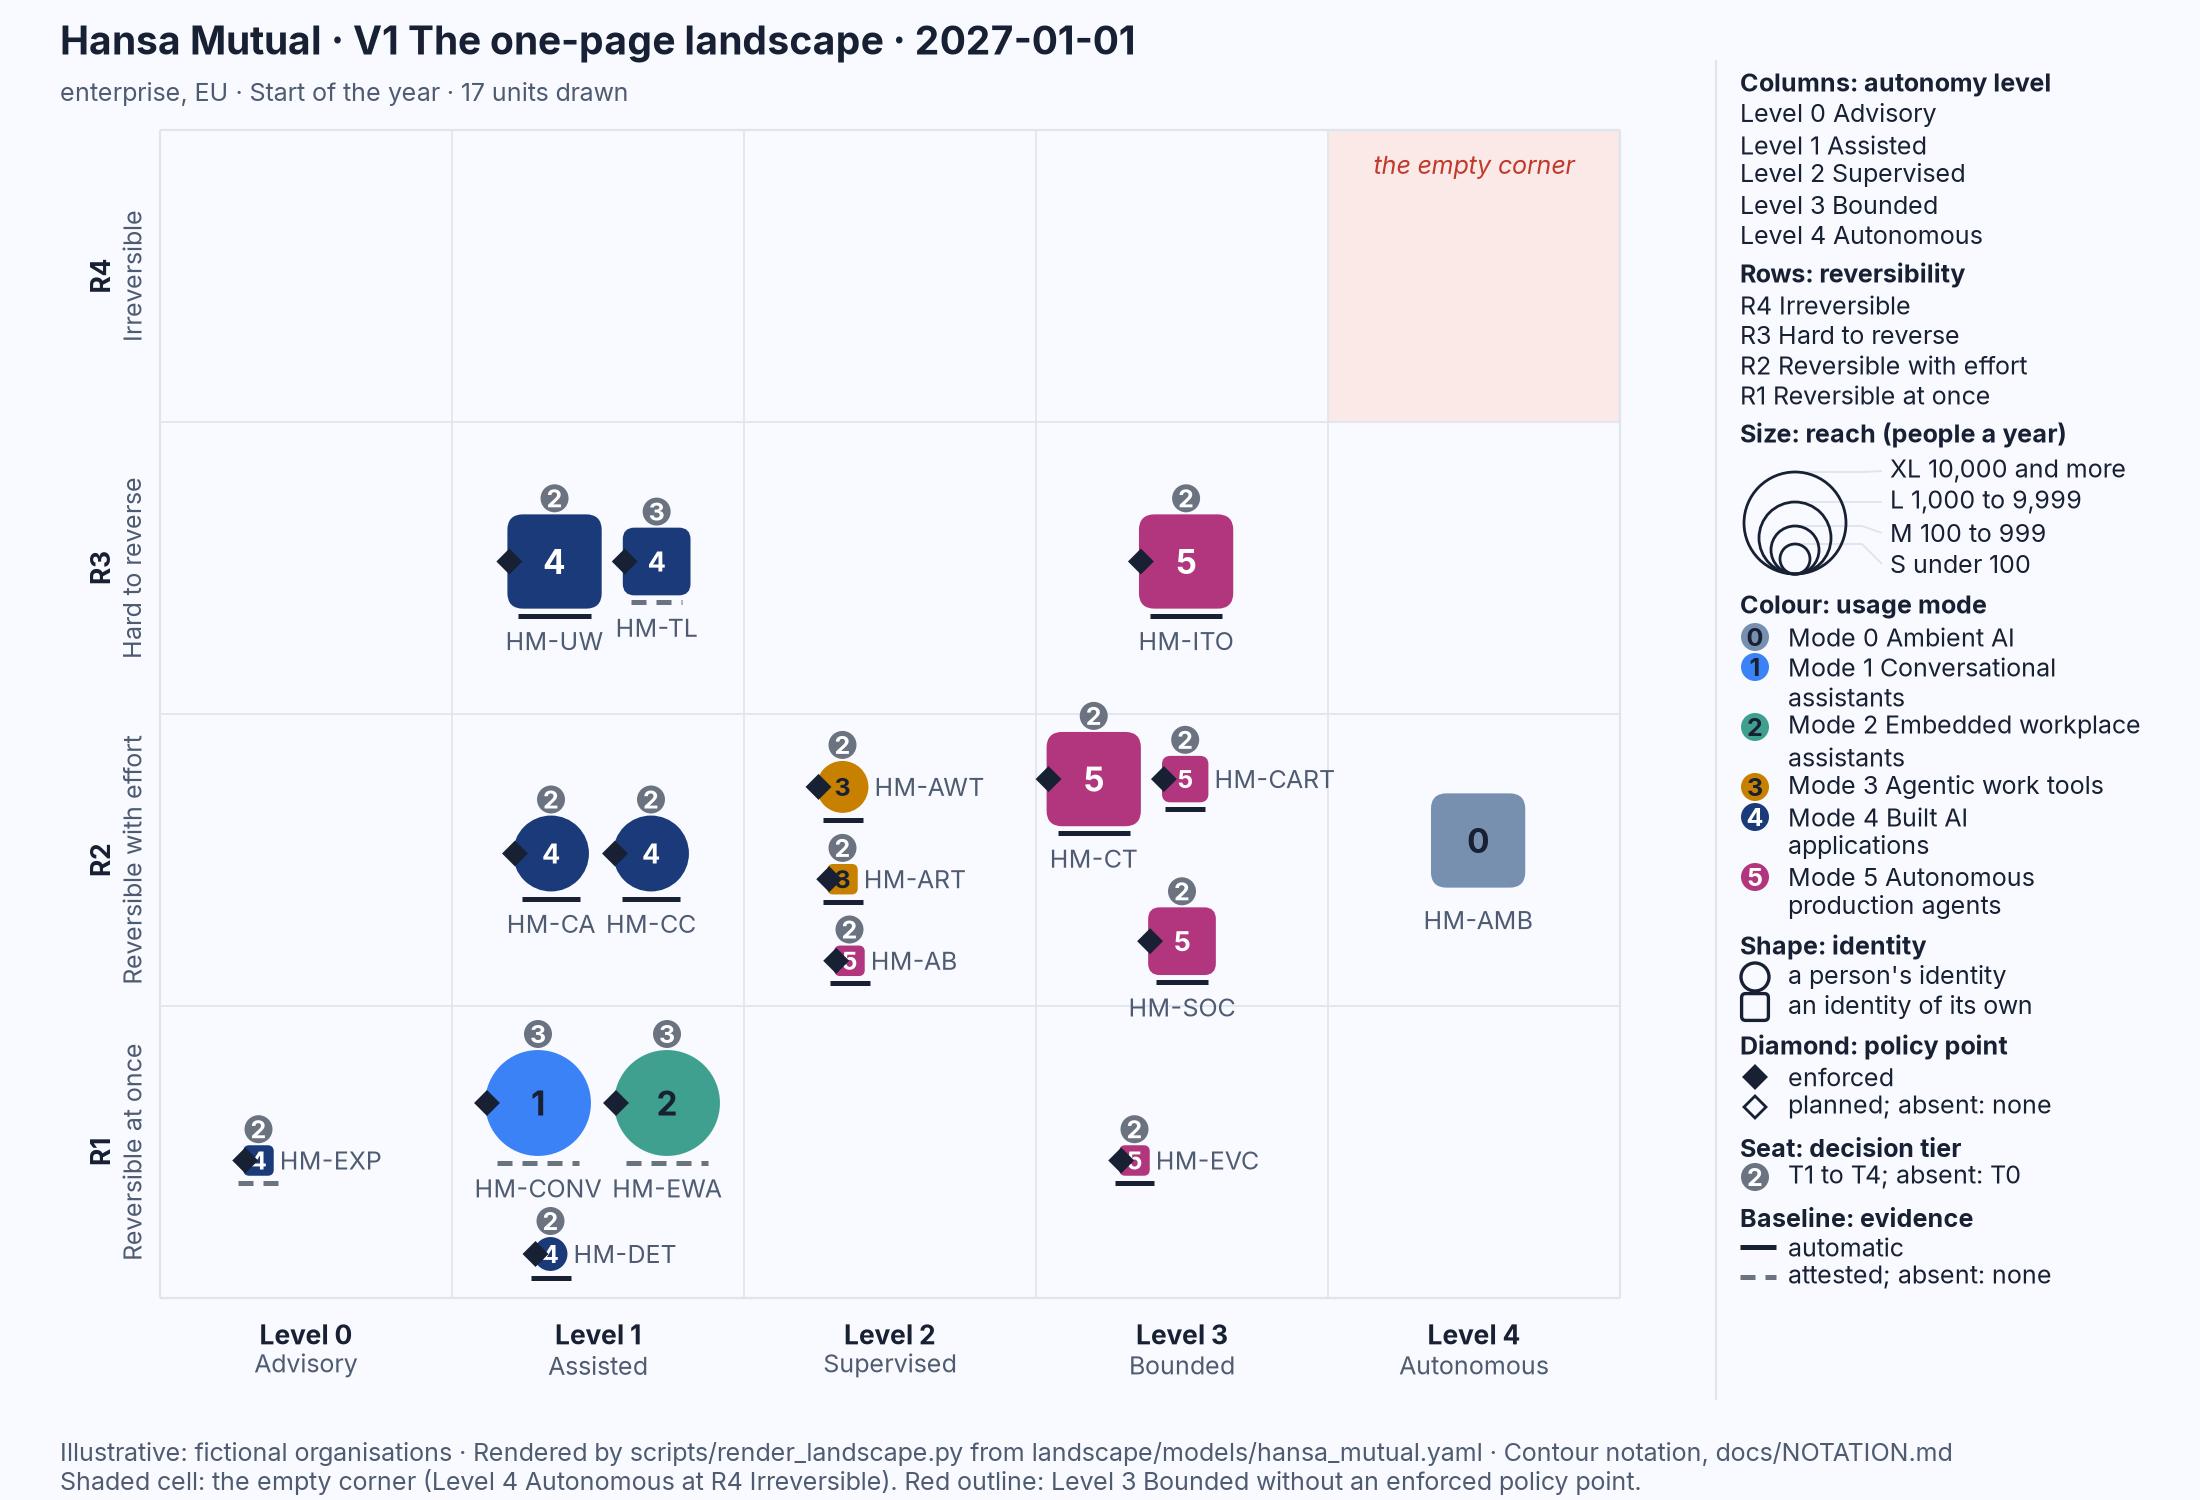
Figure 10.3: Hansa Mutual's landscape at the start of 2027, V1; the size of each mark is its reach class, the people its actions touch in a year, in four fixed sizes from S to XL. Illustrative: rendered from landscape/models/hansa_mutual.yaml.
Read it for size alone. Seventeen units are drawn and six are XL. Three of the six are things nobody at the group built: the conversational assistants on enterprise terms (HM-CONV), the embedded workplace assistants in the office suite (HM-EWA) and the ambient AI that vendors switched on inside licensed software (HM-AMB). The other three are systems the group built or bought whose actions reach its customers: the underwriting-support model (HM-UW), the claims-triage agent (HM-CT) and the IT-operations agent (HM-ITO). Four marks are L, two are M and five are S.
Two things follow. The first is that the claims-triage agent is the same size as the embedded workplace assistants. The count of claims is the number a board would be shown; the assistants would be shown no number at all. Drawn by people touched, both are XL, and the picture says that the group's largest AI uses are three things nobody built and three things it did. The size instinct hides that comparison.
The second is that size says nothing about risk on its own, which is why it is one of seven dimensions. HM-CT is XL, a rounded square because it acts with an identity of its own, in the Level 3 Bounded column, with a filled diamond (a policy point outside the model that enforces what it may do) and a seat marked T2 (the system owner holds the decision right). HM-AMB is also XL, also a square, but in the Level 4 Autonomous column, with no diamond and no seat. The two marks are the same size and could hardly be more different. What size does is make the reader ask about the right marks first.
I chose four fixed sizes rather than a continuous scale because a notation sketched on a whiteboard in five minutes cannot have forty sizes, and because a continuous scale would invite the instinct back in through the drawing: a mark scaled to 400,000 claims would dwarf a mark scaled to 9,500 staff.
The rule of thumb
Rule of thumb: Never accept a number alone; ask what it is divided by and compared with.
The rule takes one question and one habit. The question is "out of how many?", asked of every count before it is allowed to mean anything. The habit is to look for the share beside the count and the count beside the share, as Figure 10.1 does. When no denominator exists, the number is not worthless: it is a numerator, any rate built on it is speculation, and the honest sentence names the gap.
The rule stops applying at the top row of the landscape. A denominator corrects the size instinct; it does not excuse a harm. One irreversible outcome for one person, a wrongly refused benefit that cannot be undone or a dataset disclosed that cannot be recalled, is not made small by dividing it by the number of cases that went well, and the reversibility rows exist so that such outcomes are seen by position rather than lost in a rate. Divide to see the size of a thing. Do not divide to see whether it matters.
What to do
For an executive
Ask for the denominator on every slide, and send back the slide that has none. A count of requests, documents, tokens or blocked attacks measures activity, not size; ask how many people it touched, out of how many, over what period, and whether the earlier number was produced the same way as the later one. When nobody knows the denominator, treat that as the finding. The reach class of each unit, S to XL, is the number to ask for.
For an architect
Record reach in the landscape model as a count of people and nothing else, and write down how the count was made. The model's reach field takes one of four classes; the comment beside it should say who was counted, so that the next person does not quietly substitute a transaction count. Here is the claims-triage agent's entry in Hansa Mutual's model (illustrative), with the counting rule written where the class is given:
- id: HM-CT
  name: Claims-triage agent
  mode: 5
  identity: own
  level: 3
  reversibility: R2
  reach: XL            # claimants whose claims it routed or allocated in a year;
                       # not the number of claims, which would be larger still
  policy_point: enforced
  decision_tier: T2
  evidence: automatic
  operated_by: self
  hosting: own-premises
The discipline is in the comment. When a unit touches staff who use it and people whose cases it orders, count both and say so; when the unit is new, record the class the design expects and mark it as expected, so that the measured count can replace it. A unit whose reach nobody can state is a finding, not a gap to leave blank.
For a public official
Ask for people in every register entry and every answer. A public algorithm register that lists a system by the number of applications it processes a month tells a resident how busy the authority is; one that lists it by the number of applicants whose cases it orders tells the resident whether they are among them. When a count of incidents or attacks is presented as a reason to act, ask under which definition it was produced and whether the earlier count was produced the same way.
Nordvik Region and Hansa Mutual
Both organisations are fictional and everything in this subsection is illustrative, drawn from their canonical profiles and their landscape models.
At Nordvik Region the number everyone knows is 40,000: the claims ranker of the benefits-triage system orders about 40,000 claims a month for caseworkers who decide every case, a figure that AI Threat, Chapter 11, uses for illustration and that the Region's profile in this book does not record (5, Nordqvist, 2026). Forty thousand a month is a transaction count. The landscape model records the benefits-triage system (NR-BT) as one mark of reach XL, because the claimants whose cases it orders in a year are, in this illustration, well above 10,000 in a region of about 450,000 residents, and it places that mark at Level 0 Advisory and R3 Hard to reverse, with a filled diamond, a seat marked T2 and a solid baseline. The size says that this is among the Region's largest AI uses by the people it touches; the position says that a person decides every case and that what is decided is hard to reverse. The 40,000 would have said only that the system is busy.
At Hansa Mutual a board shown only the number of claims the claims-triage agent handled would have the size of one agent's work. The landscape sizes the agent by the claimants whose claims it touched, and the mark is XL, the same size as the embedded workplace assistants every employee uses and the ambient AI nobody chose. The table gives the six XL units and who is counted for each; the counts behind the classes are illustrative, because the model records the class and not the count.
| Unit | Reach class | Who is counted (illustrative) | What the size instinct would have counted instead |
|---|---|---|---|
| HM-CT Claims-triage agent | XL | Claimants whose claims it routed or allocated in the year | Claims handled, a far larger number |
| HM-UW Underwriting-support model | XL | Applicants for life and health cover whose risk it assessed | Quotes produced |
| HM-ITO IT-operations agent | XL | Staff and customers who depend on the production systems it operates | Operations executed |
| HM-EWA Embedded workplace assistants | XL | Staff across the group who use them, and the customers whose correspondence passes through them | Nothing; no count is shown |
| HM-CONV Conversational assistants | XL | Staff who use them under enterprise terms, and the people whose matters they draft | Prompts or tokens |
| HM-AMB Ambient AI in licensed software | XL | Staff and customers touched by vendor features in seven markets | Nothing; the features were not counted |
At Nordvik the correction puts a public-facing system among the largest marks, which is where the Region's attention already is. At Hansa it puts three units nobody built beside three the group did. A board shown only a claims count has been shown the size of one unit's work; the landscape shows six, and asks which of the six it has looked at.
Summary
The size instinct is the habit of being impressed by a large number without the denominator, the base rate or the comparison that would tell us whether it is large. It is useful almost everywhere, and it misleads in this landscape for three reasons: the numbers arrive without denominators because denominators are hard to produce, the denominators grow at the same time as the numerators, and the same fact can be counted against several denominators and give a different number each time.
The evidence showed each of these. The Union's ICT specialists nearly doubled in count between 2011 and 2025 and moved from 3.0 to 5.0 per cent of employment, and 10.45 million sounds large until it is set against a target of 20 million (12, Eurostat, 2026) (15, European Commission, 2026). AI in use in enterprises in 2025 was 19.95 per cent of all, 55.03 per cent of large and 17.0 per cent of small: one fact, three denominators. The 32.66 per cent of individuals using a generative AI tool for any purpose and the 15.36 per cent using one for work are different facts about different units (9, Eurostat, 2026) (14, Eurostat, 2026). The AI Incident Database's count rose from 91 in 2020 to 463 in 2025 while adoption rose, and no public dataset provides the deployments that would turn the count into a rate (35, Responsible AI Collaborative, 2026).
The notation corrects the picture by giving size one job. The area of a mark is the unit's reach, the people its actions touch in a year, in four fixed sizes, S to XL, and not a count of transactions. On Hansa Mutual's landscape (illustrative) the claims-triage agent that a board would hear of by its claims count is the same size as the workplace assistants it would hear of by no count at all, and six XL marks, not one, are the places to look first.
The rule of thumb is: never accept a number alone; ask what it is divided by and compared with. It corrects the size of a thing and does not excuse a harm; one irreversible outcome for one person is not made small by a rate, and the reversibility rows exist so that it is seen by position. Chapter 11 turns to the destiny instinct: the belief that where this landscape is going has already been settled, in a landscape where architecture that was documents is now code that changes weekly and where the law's own dates have moved.
Sources
- Nordqvist, G. (2026). AI Threat: Are the Dystopias Coming True? Evidence, Risk and Response for European Enterprises and Public Authorities. aithreat.geon.se. (5, Nordqvist, 2026)
- Rosling, H., Rosling, O. and Rosling Rönnlund, A. (2018). Factfulness: Ten Reasons We're Wrong About the World – and Why Things Are Better Than You Think. London: Sceptre. (8, Rosling et al., 2018)
- Eurostat (2026). Artificial intelligence by size class of enterprise. Online data code isoc_eb_ai. (9, Eurostat, 2026)
- Eurostat (2026). Employed information and communications technology (ICT) specialists. Online data code isoc_sks_itspt. (12, Eurostat, 2026)
- Eurostat (2026). Individuals - use of generative AI tools. Online data code isoc_ai_iaiu. (14, Eurostat, 2026)
- European Commission, Directorate-General for Communications Networks, Content and Technology (2026). Digital Decade DESI dashboard: Digital Decade EU-level trajectories and Digital Economy and Society Indicators. (15, European Commission, 2026)
- Maslej, N., Fattorini, L., Perrault, R. et al. (2025). The AI Index 2025 Annual Report. AI Index Steering Committee, Institute for Human-Centered AI, Stanford University. (17, Maslej et al., 2025)
- European Commission, Directorate-General for Employment, Social Affairs and Inclusion (2025). Artificial Intelligence and the future of work. Special Eurobarometer 554. (29, European Commission, 2025)
- Responsible AI Collaborative (2026). AI Incident Database. Weekly snapshot of 2 November 2026. (35, Responsible AI Collaborative, 2026)
- Organisation for Economic Co-operation and Development (2026). AIM: AI Incidents and Hazards Monitor. OECD.AI Policy Observatory. (36, OECD, 2026)
- European Union Agency for Cybersecurity (2024). ENISA Threat Landscape 2024. (37, ENISA, 2024)
- European Union Agency for Cybersecurity (2025). ENISA Threat Landscape 2025. (38, ENISA, 2025)
- McGregor, S. (2021). Preventing Repeated Real World AI Failures by Cataloging Incidents: The AI Incident Database. Proceedings of the AAAI Conference on Artificial Intelligence, 35(17). (50, McGregor, 2021)
- European Parliament and Council of the European Union (2022). Decision (EU) 2022/2481 of 14 December 2022 establishing the Digital Decade Policy Programme 2030. Official Journal of the European Union, L 323. (43, European Union, 2022)